Do MT4 Gold Volume Bars Represent Real Traded Lots? Start with Tick Volume
Volume bars on XAUUSD charts are often quote update counts and cannot be read directly as total market traded lots. This illustrated guide explains Tick Volume, exchange futures volume, and how to compare them correctly.
Author: Thomas | Technical Analysis Tutorial | October 27, 2026
When you open an MT4 gold chart, there is often a row of blue or green volume bars below the candlesticks. Seeing a bar suddenly grow taller, many people say "gold volume is expanding, the main force is buying." That statement skips two questions: what exactly does the "volume" on the chart measure? Can a tall bar indicate buying direction? This article answers only this one search question; all figures are original teaching illustrations, not live market data.
First distinguish tick count from traded lots
MetaQuotes' official MQL4 documentation defines the iVolume return value as the Tick Volume of the specified candlestick, i.e., the number of quote updates received during that candlestick. The official MetaTrader help also distinguishes quote tick volume from actual volume when exchange data is available; for OTC instruments, real volume may not be available. The XAUUSD offered by most brokers is an OTC quote, so the volume bars on screen usually reflect how frequently that data source updated during the period, and cannot be read directly as how many lots of gold traded worldwide in total. The specific platform, instrument, and data supply method still need to be verified; do not rely on the indicator name alone.
CME publishes volume and open interest reports for its exchange-traded futures and options. Gold futures GC traded lots have an exchange basis, but that is still only data for the corresponding contract and trading venue, and cannot be treated as the total for all OTC spot gold. Putting an MT4 XAUUSD volume bar from one broker, tick counts from another broker, and CME GC volume on one chart and directly comparing their sizes involves inconsistent units and sources.
Illustration: a high volume bar does not equal a rise
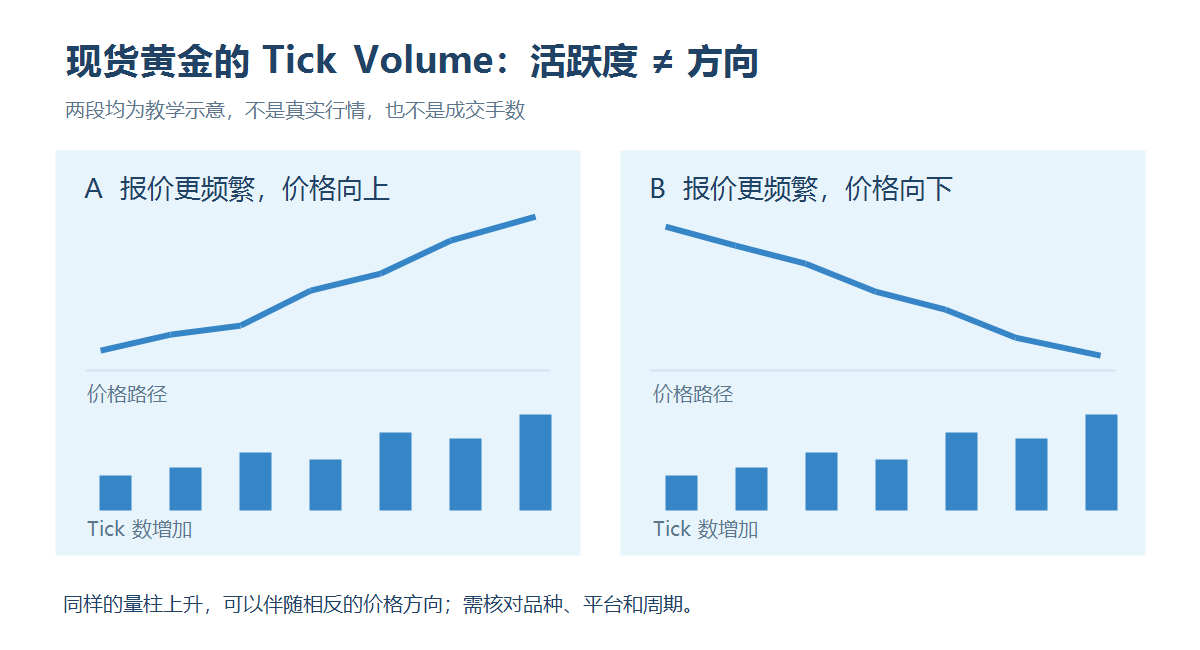
In the figure, the volume bars in segments A and B have the same shape, both indicating that quote updates are becoming more frequent; A's price path goes up, while B's goes down. The reason is straightforward: Tick Volume records update counts and does not interpret each update as net buying. Even if replaced with real exchange volume, total volume alone is not enough to know the aggressiveness behind each trade, position direction, and subsequent price. If news causes rapid up-and-down jumps, a tall bar may even be merely the result of increased volatility.
Four steps to understand your own volume bars
First, confirm whether the chart instrument is broker XAUUSD or exchange gold futures, and check the platform's explanation of the Volume field. Second, compare volume bars using the same platform, same instrument, and same timeframe; a one-hour bar usually contains more quote updates and should not be compared with a one-minute bar by absolute height to see "which is more active." Third, compare only completed candlesticks. An unfinished bar naturally grows over time, and comparing it with the previous completed bar easily leads to false conclusions. Fourth, look at volume bars together with price structure: after breaking above a range, can price stay outside the range, and after pulling back, is it pushed back inside; volume bars only provide clues about activity strength and cannot replace this price evidence.
Here is a purely teaching example: among two consecutive completed one-hour bars, the second has more ticks, yet price falls from the upper edge of the range back inside. You can record "updates more frequent, but breakout not sustained," and must not write "volume expansion confirms a rise." If another platform has a different data feed, even if the volume bar height for the same hour differs, there is no need to force an explanation that someone is manipulating the market.
When it fails
Broker data source switches, changes in trading sessions, brief server interruptions, and incomplete chart history can all change tick statistics; spreads and price jumps around major news can also disconnect quote activity from what is actually executable. Setting "volume bar gets taller" as the sole entry condition ignores both direction and execution costs. A more prudent approach is to first determine the data basis, then keep three types of samples—bullish, bearish, and invalid—and check whether this kind of volume bar change has persistent explanatory power on your own platform. Chart tools can only help organize observations and cannot guarantee the next trade's return.

MT4 EA troubleshooting guides →