After a Trendline Break, How Do You Distinguish Weakening Trend from an Ordinary Pullback?
A trendline break is a prompt to re-examine the trend, not proof that direction has reversed. Original schematics illustrate drawing lines, retests, structure confirmation, and invalidation conditions.
Author: Thomas | Technical Analysis Experience | October 25, 2026
An upward trendline being broken looks striking on the chart, yet the next candlestick may quickly recover. How do you judge whether this is a weakening uptrend structure or ordinary volatility temporarily piercing the line? The key is not to draw the line more "accurately," but to first specify how the line is drawn, the observation timeframe, and what subsequent price behavior would overturn the judgment. This article discusses general methods and does not use historical quotes from Sunday market closures to impersonate real-time gold market data; the illustrations are original educational schematics, not live screenshots.
A Trendline First Needs a Fixed Convention
Fidelity's trend fundamentals material describes an uptrend line as a straight line connecting two or more lows and extending to the right, with the second low should be higher than the first. It can be used to observe dynamic support during an uptrend, but price breaking below the line is only a warning that the trend may be changing and still requires other signals to check. Different people choosing different lows, wicks versus closing prices, and chart timeframes will draw different lines; a single line cannot be an objective boundary shared by all platforms.
At the start, select two completed swing lows on the same platform and same timeframe, and record their times and the basis for selection. After drawing the line, do not keep moving the second anchor to fit new price action. If three or more lows are near the same area, the line may be easier to observe, but the number of touches also cannot prove future validity. The steeper the line, the more sensitive it is to normal pullbacks; especially do not forget volatility amplitude just because the chart looks nice.
First Look at Where the Break Occurs
The blue line in the chart represents a pre-drawn uptrend line, and the dark blue path represents hypothetical price. The first downward cross only enters the observation stage. If it is only a wick of an incomplete candlestick crossing while the close returns above the line, that is different information from a completed candlestick breaking below and subsequent candlesticks remaining below the line. Also compare the most recent completed swing low: if lows are still successively rising, the uptrend structure may not immediately turn bearish just because one line fails; if price breaks below that low, evidence that the original structure is weakening increases.
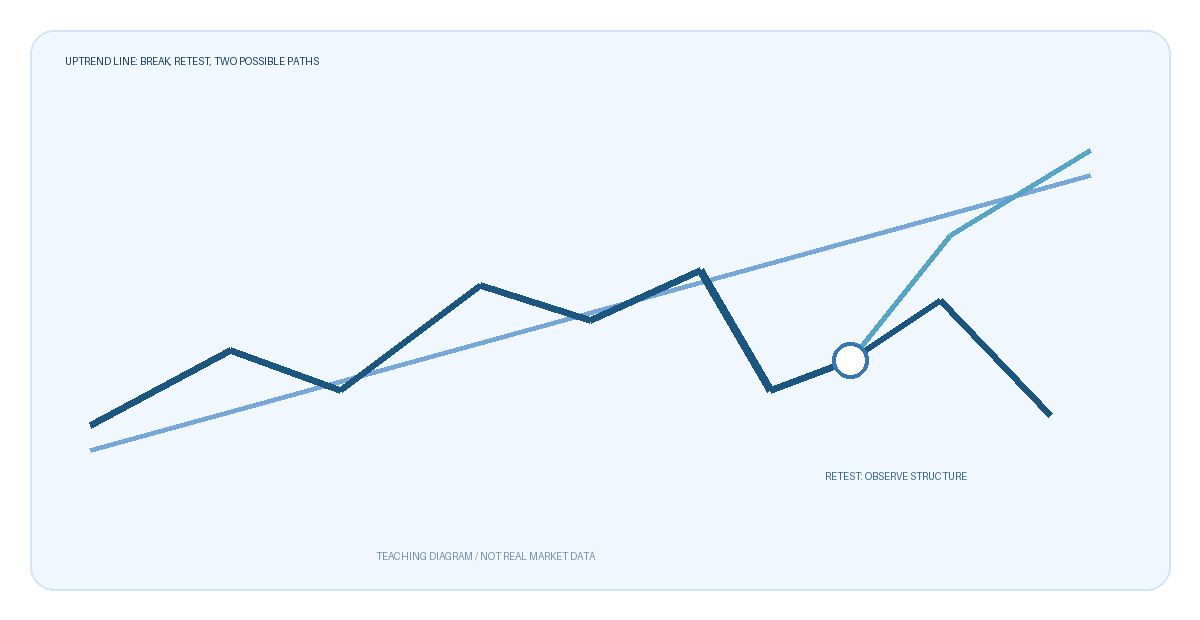
This chart has no real dates, trading platform quotes, or profit results. The "retest below the line" marker only illustrates one observation path; it does not mean a retest will occur after every line break, nor is it an order instruction.
Is a Retest Confirmation or a Trap?
Some price action breaks below, rebounds to near the original line, and then declines again; in other cases, price quickly returns above the line and continues to raise lows. Do not assume the former will necessarily happen. If you adopt "weakening after the break" as a working hypothesis, you can specify in advance: completed candlestick below the line, the most recent structural low broken, and the retest failing to recover the original range—which of these three must hold simultaneously. As long as price returns above the line and subsequently forms higher highs and lows, the bearish judgment should be withdrawn or downgraded.
If you adopt "ordinary pullback" as the hypothesis, focus on whether the prior low holds and whether price can quickly return to the original structure after the break. If rebounds are repeatedly rejected and then form lower highs and lower lows, the ordinary pullback explanation should also be invalidated. The emphasis here is on two scenarios that can be overturned, not a prediction of which side the market will choose. News releases, gaps, platform quotes, and spread changes may cause repeated crossings near the line; a tiny single crossing is especially unsuitable for isolated interpretation.
What to Record to Reduce Hindsight Line Drawing
Save the original chart, drawing time, anchors, candlestick timeframe, broker used, and the invalidation conditions set at the time. After some time, check only the recorded rules, rather than re-selecting the "correct" line based on the outcome. You can also record counterexamples: breaking below then immediately pulling back, continuing downward without reaching the line on a retest, and multiple line crossings within a range. If these situations occur frequently, it may indicate the environment is range-bound and the trendline method itself is not applicable.
Trendline chart reading can organize observations, but it cannot replace position sizing and risk budgeting. Especially for XAUUSD, charts may display Bid prices, while actual trading is also affected by Ask, spreads, and slippage. No single pattern can guarantee returns; when boundaries are unclear and costs are too high relative to volatility, keeping the option of "no judgment" is more honest than forcing a label of reversal.

MT4 EA troubleshooting guides →