Should You Sell Gold When RSI Exceeds 70? Overbought, Divergence, and Invalidation Conditions
Use light-colored original educational charts to explain the meaning of RSI 70/30, persistent overbought conditions in strong trends, and what two sets of peak-and-trough evidence divergence requires.
Author: Thomas | Technical Analysis Tutorial | October 20, 2026
"RSI has reached 70—is it time to sell gold?" This is a common indicator search question. The answer is not a fixed trading instruction. RSI compresses the relative strength of price rises and falls over a period into a 0–100 scale; 70 and 30 are common reference levels, not boundaries at which price must reverse. Below, we only discuss how to read charts and how to rule out misjudgments, and we do not discuss today's gold price levels.
What RSI Measures and What It Does Not Measure
The Relative Strength Index was proposed by J. Welles Wilder and is a momentum oscillator. It observes the strength of upward changes relative to downward changes in the selected period; the higher the value, the relatively stronger the upward momentum within that calculation window. The common default setting is 14 periods, but "14" can mean 14 daily bars or 14 hourly bars; without first specifying the chart period, two RSI readings are not directly comparable.
Fidelity's technical indicator explanation calls above 70 the traditional overbought zone and below 30 the traditional oversold zone, while also warning that in strong trends the indicator may remain in these zones for a long time. Therefore, "overbought" means recent gains have been strong or fast; it does not mean the asset is already too expensive, nor does it mean the next candlestick must fall.
Fix the Chart First, Then Read the Signal Once
Step one: fix the instrument, quote source, chart period, and RSI parameters. For example, choose the four-hour chart and 14-period RSI on the same platform, and do not switch to the most favorable period after seeing the result. Step two: first look at price structure: is it making consistently higher highs and lows, or moving back and forth within a range? Step three: then check whether RSI is only entering above 70 for the first time, or has entered multiple times and risen again after pulling back. Finally, write down the price conditions that would overturn the judgment.
If price still maintains higher highs and higher lows, declaring a top merely because RSI reads 72 is insufficient evidence. If price structure has already weakened and RSI is falling back from a high level, there is reason to further examine whether momentum is fading. Even here, "weakening momentum" still cannot be directly equated with "price must reverse."
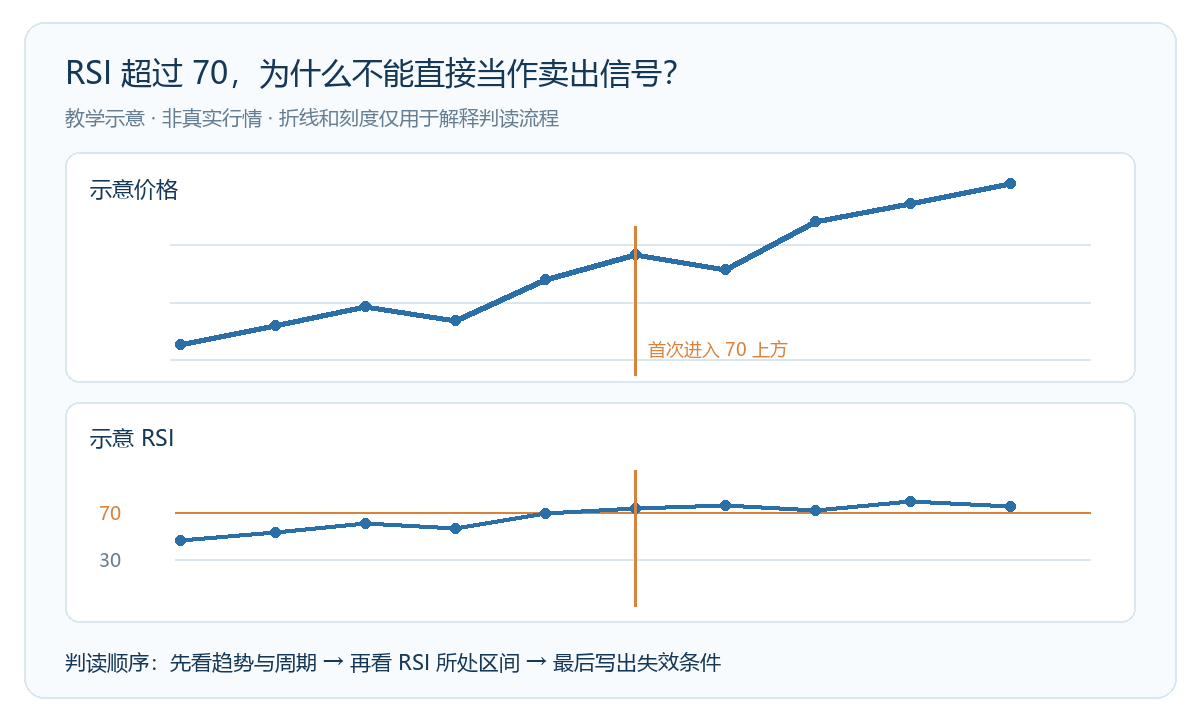
The price line and RSI line in the figure are entirely drawn for this article for educational purposes, with no dates, real quotes, or historical win rates. The vertical line indicates the illustrative moment when RSI first crosses above 70; price on the right may still rise, showing that a single crossing is insufficient to conclude that one should sell.
Divergence Requires Two Peaks and Troughs, Not Just One Line
So-called bearish divergence usually means price forms a higher high while the RSI high in the same window is lower. What should be compared are two completed peaks that correspond in time, not an arbitrarily chosen intraday spike and a closing point. Quotes, indicator calculations, and peak selection on different platforms may produce different divergence results.
Even if divergence is found, it can only be said that the upward momentum of this move may be weakening; price may still continue for a while. "Breaking below the most recent swing low marked in advance" can be used as a further observation condition. If price continues to make new highs, the structure is not broken, or a new RSI high rises again, the earlier interpretation of weakening should be given less weight, rather than continually moving the two comparison points.
Which Scenarios Are Most Easily Misread
When the trend is very strong, RSI remains above 70 for a long time, and repeated counter-trend attempts may incur sustained losses; in range-bound conditions, swings near 70 and 30 also do not guarantee success every time the boundary is reached. Shortening the parameter makes the indicator more sensitive and noisier; lengthening it makes reactions slower. Screenshots from different periods and different parameters must not be mixed together, keeping only the most accurate one after the fact.
Another common mistake is treating RSI crossing above 50, overbought conditions, and divergence as the same type of signal. They respectively describe the position of the neutral line, a relative momentum zone, and the relationship between two sets of peaks and troughs in price and the indicator, and they require different evidence. First write clearly which claim you are actually testing, then record counterexamples.
A Reviewable Learning Record
Save the chart period, parameters, price highs and lows, corresponding RSI values, and screenshot time at the time, and write in advance when the judgment will be considered invalid. Afterward, regardless of how the market moves, keep the original markings. Technical indicators are used to organize observations and cannot bypass trading costs, spreads, and risk budgets. The illustrations in this article do not represent real XAUUSD market data and contain no buy or sell advice or return guarantees; leveraged trading may cause substantial losses.

MT4 EA troubleshooting guides →