The MT4 EA backtest curve looks great, so why can't it be used directly on a live account?
Choose the modeling method based on the EA trigger logic, and check historical data, spreads, reports, and overfitting risk item by item; includes an original white-and-blue flowchart.
Author: Thomas | EA and MT4 Practice | October 24, 2026
On weekends you don't have to chase real-time quotes, so it's a good time to organize EA backtests. But seeing a beautiful curve in the MT4 Strategy Tester does not mean the EA has passed real trading validation. This is especially true for short-term gold EAs, whose entries and exits often occur within a single candlestick; if the historical data and modeling method used in the backtest cannot reproduce these fluctuations, the results may appear overly optimistic for the same set of rules. This article only discusses the conditions and limitations of how to read a backtest report, and does not present fabricated live trading results.
First ask when the EA makes decisions
The official MT4 Strategy Tester documentation provides historical data modeling methods such as "Open prices only," "Control points," and "Every tick." Open prices only is faster and is mainly suitable for strategies that process the previous completed candlestick only when a new candlestick arrives. If the EA triggers orders, moves stop losses, or judges highs and lows based on prices within a candlestick, the open prices only mode may miss key paths. You should not assume that because "Every tick" sounds the most precise, it must reproduce all real historical tick-by-tick executions; if the underlying historical data used for testing is incomplete, price paths may still be generated through interpolation and simulation.
Therefore, the first step is to read the EA code or documentation and list whether it depends on completed candlesticks, intraday quotes, spreads, or trading sessions. The second step is to choose a modeling method consistent with the logic. Putting an EA that only looks at closing prices into a finer mode may also increase time cost, but putting an intraday stop-loss EA into open prices only mode often hides the execution details that most need validation.
Record at least six conditions in the report
Save the trading symbol, broker server, test date range, chart timeframe, historical data source, modeling method, and spread settings. The official tester help states that, by default, the spread used to simulate the Ask price may be the current spread for that symbol at the time the test starts. This means that the cost conditions for the same strategy may change on different test days and under different spread settings. If you only write "backtest net profit" without explaining the spread, commissions, overnight fees, and trading frequency at the time, the results cannot be reproduced.
The number of trades, maximum drawdown, and consecutive losses must also be examined together. High returns from a few trades cannot prove statistical stability; over a longer history, you still need to check for large data gaps, abnormal gaps, and changes in platform rules. The contract size per lot, trading hours, and minimum stop-loss distance of different XAUUSD contracts will also change the EA's order behavior on a live account. Before weekend testing, check the MT4 symbol specifications first, and do not directly copy parameters from another platform.
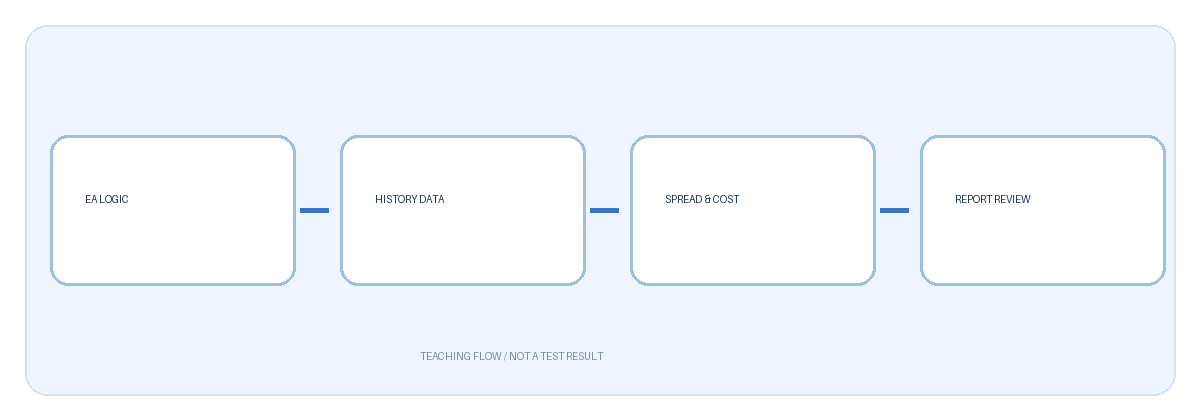
The diagram breaks the process into four checkpoints: strategy trigger logic, historical data coverage, quotes and costs, and report review. It is a flowchart drawn for this article and contains no real trading results. If any checkpoint is not clearly explained, the profit figures that follow lack a basis for interpretation; after completing the materials, comparing different test results is more meaningful than immediately optimizing parameters.
How to judge overfitting risk
If you repeatedly change indicator periods, stop losses, and trading sessions on the same historical period until the curve "looks best," and then use the same historical period to declare the strategy effective, you are treating the test data as both the practice questions and the exam answers. A basic approach is to separate in advance a development interval from a later validation interval that was not involved in parameter tuning, and to record the reason and version for each change. If performance deteriorates significantly on data not involved in parameter tuning, the earlier good results may depend on a specific historical sample. This judgment is still not a forecast of future returns; market conditions and execution costs will change.
You should also examine the price and order logs around each trade, rather than only looking at total return. Focus on checking whether stop losses are triggered as expected, how the EA handles rejected orders or error codes, whether it still opens positions when spreads suddenly widen, and whether it mistakenly treats unfilled orders as filled. If necessary, use a demo environment to observe operational stability on new data; a demo environment also cannot replace the slippage and liquidity risks of a live account.
An actionable weekend verification sequence
First back up the EA parameters and historical data version, then determine the test dates, time zone, and fees; run the mode consistent with the EA trigger mechanism and save the complete report and logs; check trade by trade the periods with large drawdowns and abnormal profits; finally retest using a period not involved in parameter tuning. If data coverage is insufficient, the spread assumption is unreliable, or there are errors in the order logs, write the conclusion as "cannot determine" and do not fill in imagined live trading results. Leveraged trading may cause substantial losses; backtesting is not a guarantee of returns.

MT4 EA troubleshooting guides →