After gold's sharp drop, a V-shaped rebound: reversal or covering? First check whether the structure is reclaimed
The first bullish candle after a sharp drop is not enough to prove a trend reversal. Use original illustrative diagrams to break down the structural low, reclamation, retest, and invalidation conditions for two scenarios.
Author: Thomas | Technical analysis experience | November 1, 2026
After a sharp drop in gold, a very long bullish candle often prompts people to immediately call a "V-shaped reversal." But the initial rebound only proves that buying interest appeared at the low; it cannot by itself prove that the prior decline structure has ended. Especially in environments with high volatility, the start of the week, or after data releases, short covering, liquidity recovery, and genuine trend repair can all produce a similar first leg up. This article uses educational illustrations to discuss review steps; it does not show real market screenshots or give same-day price levels.
First look at the chart: the same rebound can have two outcomes
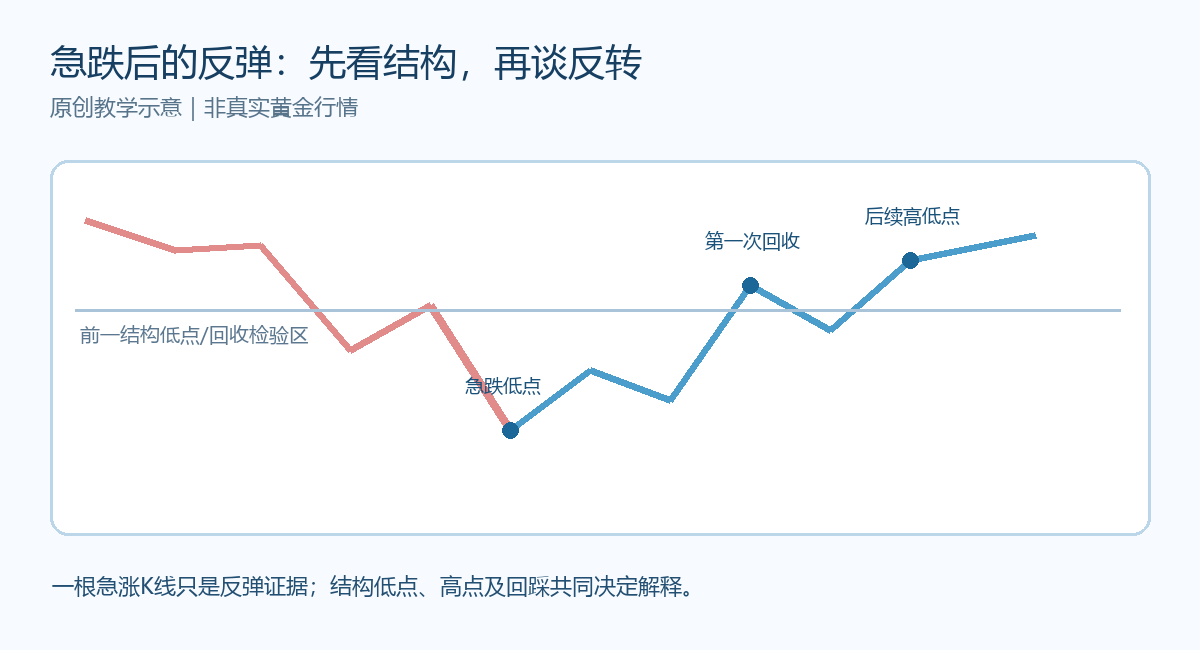
In the chart, price first forms a downward progression, then rebounds quickly from the low. After the first leg up, if price is still below the prior structural low that was broken, it can only be called a rebound for now; if it continues to reclaim that area and holds a higher low on the retest, the repair interpretation gradually strengthens. Conversely, if the rebound cannot get back above the prior decline pivot and price breaks below the sharp-drop low again, the rebound is a failed sample. The lines and distances in the chart have no actual quote meaning; the purpose is to show that "location and subsequent path" matter more than the color of a single candle.
First fix the structural scale when reviewing
Step one is to choose the analysis timeframe; do not look at a daily bearish chart and suddenly use a five-minute bullish candle to declare a daily reversal. Mark the last confirmed swing high, swing low, and the prior low that this sharp drop broke on that timeframe. CME's technical analysis education notes that pullbacks, sideways movement, and continuation can all occur, and that top or bottom formations are difficult to identify at the moment they form and require subsequent confirmation. CMT Association materials describe an uptrend as a sequence of higher highs and higher lows, and a downtrend as the opposite. These are tools for identifying structure, not predictions that price must follow a certain template.
Step two is to look at the "quality" of the rebound: does price only spike on one candle and then immediately retrace; or does it continue to raise lows over several periods? If it crosses the prior structural low, can the subsequent retest hold? If the rebound shoots straight through multiple areas without an observable retest, judgment can be deferred. Waiting for more evidence may miss the lowest point, but it can reduce the error of writing every short covering move as a trend reversal.
Constrain the two interpretations with invalidation conditions
The premise of the reversal interpretation can be that price returns to the previously lost range, forms a higher low, and then later crosses the rebound high. If the retest breaks below the sharp-drop low again, this interpretation is invalidated; if a higher low never forms, it can only remain as "repair pending confirmation." The decline-continuation interpretation is that the rebound stops below the prior structure and a lower low appears again. If price stabilizes back above the lost range, the bearish interpretation should be downgraded. Both conditions must be written down before observation to avoid changing the story after the market has moved.
For short-term traders, also record spreads and execution times. Screen highs and lows under wide spreads may differ from actual executable prices, and candle segmentation on different platforms can also change the location of highs and lows. Do not directly apply the same educational structure to your own EBC or other platform quotes; redraw the chart using that platform's actual trading sessions and instrument data.
Breaking down a common failure case
Imagine price rebounds sharply from a decline, the second candle continues higher, and the trader places a stop very close and chases the entry. Price then reaches near the prior broken low but cannot hold above it; on the pullback it first hits the stop placed tight to the market, then oscillates in the original range. The problem is not necessarily that the "pattern failed"; it may be that before entry the trader did not specify the timeframe on which the judgment is based, the retest tolerance, and the full risk budget. This is a fictional educational scenario, not a real trading experience, and there are no real prices.
When reviewing, break failures into three categories: wrong structural judgment, premature timing, and unreasonable trading costs or position sizing. If every loss is attributed to the market "deliberately hunting stops," it becomes difficult to improve the controllable parts. Record several similar successful and failed samples and compare the continuation rate and maximum adverse excursion after the reclamation zone to judge whether this observation method suits your timeframe. A rebound after a sharp drop can be strong or short; no structural chart can guarantee profit. Leveraged trading can amplify losses; this article is for learning only.

MT4 EA troubleshooting guides →