How is True Range (TR) calculated when gold gaps?
Use a set of hypothetical prices to demonstrate how to incorporate the previous close into True Range, and distinguish TR from ATR.
Author: Thomas | Technical Analysis | Originally scheduled for November 7 at 15:00, republished on November 8, 2026.
Summary: Use a set of hypothetical prices to demonstrate how to incorporate the previous close into True Range, and distinguish TR from ATR.
Why looking only at high minus low misses gaps
True Range (TR) describes the range of fluctuation covered by a single price bar. Ordinary range uses only the current bar's high minus low. If a new bar is entirely above or below the previous close, ordinary range misses the gap between the two. TR incorporates the previous close as well, measuring the range covered from the previous close to the current bar's price extremes. It is expressed in price units, and the direction of rise or fall cannot be read from the value itself.
Take the maximum of three differences
Keeping the same instrument, quote source, and candlestick period fixed, note the current bar's high H, low L, and the previous close C. Calculate H minus L, the absolute value of H minus C, and the absolute value of L minus C, then take the maximum of the three. Alternatively, directly subtract the lower of L and C from the higher of H and C. When the previous close falls within the current bar's high-low range, the result equals the ordinary range. When the previous close is outside the range, the result includes the gap.
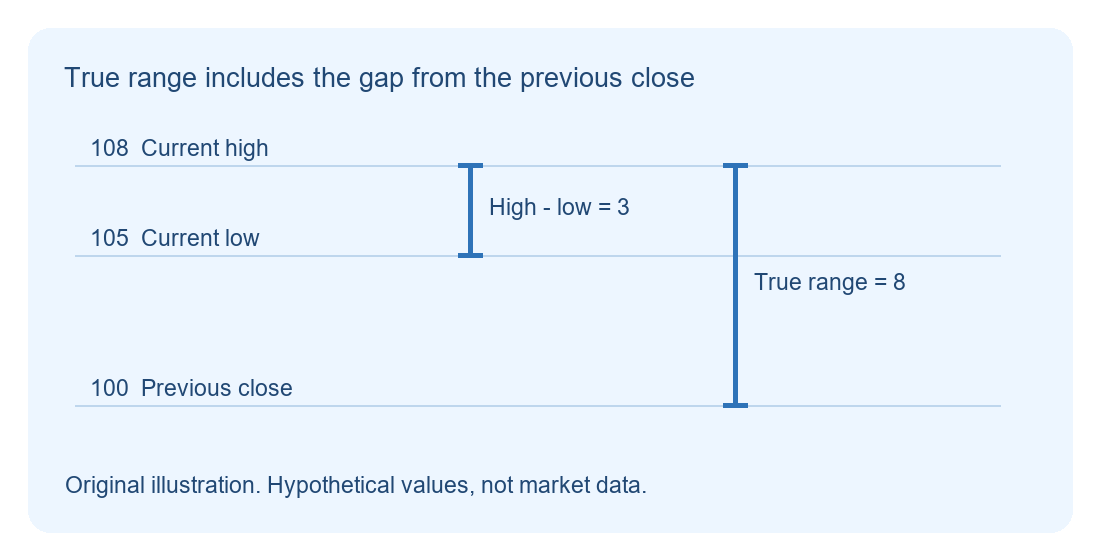
In the figure, the previous close is 100, and the next bar's high is 108 and low is 105. The ordinary range is 3, the high differs from the previous close by 8, and the low differs from the previous close by 5, so TR is 8. If the next bar gaps down, assuming a high of 95 and a low of 92, with the previous close still 100, the three results are 3, 5, and 8 in order, and TR is likewise 8. Both directions yield the same True Range, indicating that this indicator records magnitude. The values here are all teaching units.
How to check the ATR displayed by the platform
TR applies to a single candlestick, while Average True Range (ATR) smooths a series of TRs. When verifying, first manually calculate TR for any closed candlestick, then check the indicator's period and averaging method. Common implementations use Wilder-style smoothing, and some platforms also allow other averaging methods. Different windows, initial samples, or smoothing algorithms may produce different displayed results. Compare only after chart settings are consistent, to avoid mistaking calculation differences for market changes.
For example, if two hourly charts use different trading session divisions, the previous close may correspond to different quotes. Even if the intraday highs and lows shown by the two are similar, manually calculated TR may differ. First verify the server time zone, missing candlesticks, and quote history, then decide whether parameters need to be modified. The high and low of an unclosed candlestick will still change, so teaching verification should first use complete candlesticks.
In which cases should explanation be paused first
When the market reopens after the weekend, during data releases, or when quotes are interrupted, TR may rise suddenly due to gaps. First check whether the gap can be reproduced on the same platform, rule out missing data or abnormal quotes, and then explain the change in volatility. If the previous close cannot be confirmed, the current reading lacks a reliable basis. Even if the reading is credible, a larger TR only records volatility that has already occurred; the next bar may continue to expand or may return to calm. Actual execution is also affected by spreads and liquidity, and historical volatility cannot be directly treated as an upper limit on future losses.

MT4 EA troubleshooting guides →