How to Draw a Gold Uptrend Line? Test the Drawing Method With the Third Low
First draw a candidate line using two already confirmed pullback lows, then test it with a third test that appears later, avoiding moving the anchors after the fact.
Author: Thomas | Technical Analysis Tutorial | November 8, 2026
Summary: To draw a gold uptrend line, you can first select two already confirmed pullback lows that are successively higher, connect them, and extend the line to the right. Only when price approaches this line for the third time is there an opportunity to test the drawing method with a new price reaction. This article only discusses how to select and preserve anchors; hypothetical prices are used in the figures.
Step 1: Fix the Chart and Anchor Criteria
Choose one quote source, instrument, and timeframe, for example a gold hourly chart from the same broker. First check whether the price action has already produced identifiable pullback lows. In practice, you can specify in advance that after a certain number of completed candles appear to the right of a low, that low is recorded as a candidate anchor. How many candles are needed can be set according to your method; keep the criteria consistent during review, and note the time at which the low could actually be confirmed at that time. Otherwise, the beautiful lines drawn after the fact may depend on candles that had not yet appeared at the time.
Next, decide whether to use wick lows or construct a reference line based on closing prices. Wicks preserve extreme intraday quotes, while a closing-price reference line focuses on where each candle ends. The two approaches may produce different slopes, so you should first state which value is used, then apply the same rule to both anchors. If market quotes are abnormal, first check the quote history, and avoid deleting a wick merely because it does not match expectations.
Step 2: Save the Version From the Time After Connecting the Line
Connect the first pullback low with a later, higher pullback low, and extend the line to the right. If the line repeatedly cuts through obvious price fluctuations between the two anchors, recheck whether the selected lows represent the same level. The horizontal axis should use a fixed timeframe. If you switch between linear and logarithmic coordinates, or change the instrument and timeframe, note the drawing method again for later review.
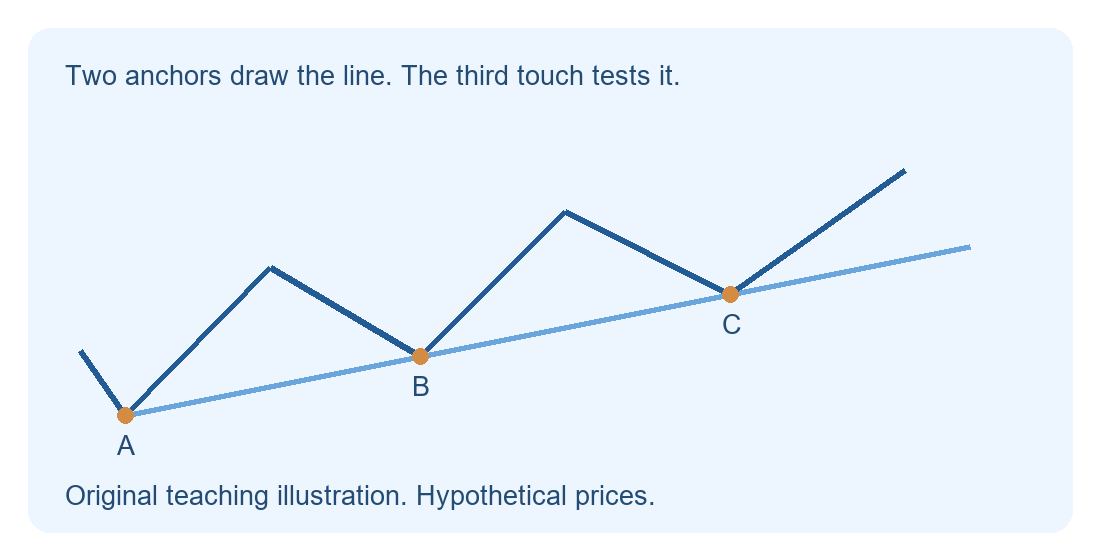
In the figure, A and B are successively confirmed lows, and the light blue line extends from the two points to the right. C represents a later approach, after which price rebounded. When drawing the line, only A and B are used; C is specifically used to test the line drawn in advance. If A or B is moved only after seeing C, the new line can be saved as the next version, but the original line and the adjustment time should be preserved.
Step 3: Observe the Reaction After the Third Approach
When price approaches the extended line, record whether it touches the line and rebounds, briefly crosses and then recovers, or remains below the line. You can define an observation zone in advance, for example by setting an explainable tolerance based on the recent normal fluctuation of the same platform, and then combine it with whether the closes on the selected timeframe and the pullback lows are still rising. Tolerance is only for consistent recording; widening it whenever price deviates will make each sample difficult to compare.
A common mistake is to define a line using two very close small fluctuations but apply the result to a larger timeframe, or to treat the first rebound directly as a buy signal. A steeper line is more sensitive to small pullbacks, and a break below may only indicate that the pace of the rise has slowed. If price remains below the line, rebounds fail to recover it, and key lows used to judge structure are also broken, the original continuation assumption should be withdrawn. Spreads and slippage during news periods will change execution results; even if the backtested drawing method is consistent, risk still needs to be assessed independently.

MT4 EA troubleshooting guides →