After a gold trendline breaks down, does it only count as weakening if the rebound is rejected?
Use a white-and-blue dual-path educational diagram to break down the evidence for trendline breaks, rebounds, and reclaims, and explain the drawing conventions, error identification, and invalidation conditions.
Author: Thomas | Technical Analysis Experience | October 22, 2026
After a trendline is crossed by price, many people rush to label the chart as a "trend reversal"; others see a rebound and immediately conclude it is a "false breakdown." Both conclusions may be too early. A trendline itself is an observational tool drawn from selected swing points, not an order price guaranteed to be executed by the platform, and certainly not the only definition of a trend. This article discusses how to record a reviewable rebound after a line break, using only original educational illustrations and not pointing to today's gold price levels.
First check whether the line has a drawing basis
An uptrend line usually connects two or more identifiable swing lows. The selected chart timeframe, whether wicks or closing prices are used, and which lows are excluded must all be fixed before observation. Charles Schwab's technical analysis education describes trendlines as tools that connect price lows to observe the slope of a trend; it does not give any line a guarantee that "touching it must rise" or "breaking below it must fall."
If anchors are constantly changed to make historical price action look nice, the moment of the break will change with the drawing method. A more prudent approach is to save the original chart and the times of the two anchors, not move the line afterward, and then record whether price briefly crossed during the session or whether the preselected timeframe had already closed below it. The same XAUUSD price action may differ across platforms in quotes, time zones, and weekend data, so candlesticks from two platforms must not be spliced together as evidence.
Why look at the rebound after a line break
A line break itself only shows that price crossed the drawn straight line. If price then returns near the original trendline, the focus shifts to: can the originally sloped observation area still be reclaimed? Does price pause there and then weaken again, or does it reclaim the line on consecutive completed candles and form a higher swing low? "Near" is used here because the line's position moves forward with time and is not a permanently fixed decimal price.
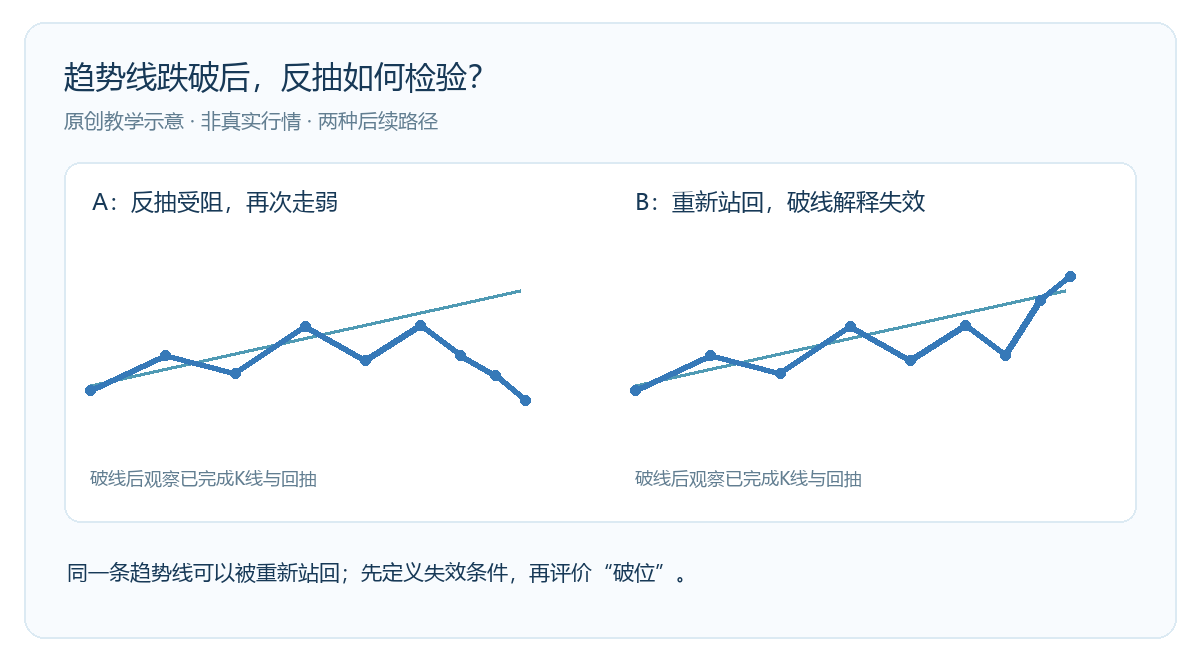
In the figure, A and B share a similar first half: price first fluctuates near the line, then crosses below it. A's rebound does not reclaim the line, and price then weakens; B crosses back above the line, and the earlier interpretation of a "sustained break" becomes invalid. Both polylines are educational drawings and do not represent any real price or test result. They remind us that confirming and retracting judgments must use subsequent evidence, not just a single crossover point.
Record two opposite outcomes
Suppose the original plan was to observe the trendline on a one-hour chart; then you should wait for the one-hour candle to complete and keep the line's anchors, the time of the cross, the closing position, and the position of the subsequent rebound. If price remains below the line after the rebound and a lower swing high appears, the interpretation that the original upward structure is weakening has more support; if price reclaims the line and keeps higher lows during subsequent pullbacks, the earlier assumption of a sustained break should be given less weight.
Both conditions are analytical frameworks, not buy or sell instructions. If the daily chart is selected, a five-minute candle's brief break above or below cannot substitute for daily confirmation. If price crosses the line multiple times during the session and direction keeps changing, it is more likely that the line's slope is too steep, the market has entered a range, or the selected anchors are unstable. At that point, there is no need to force a distinction between "true break" and "false break"; the structure can first be marked as unconfirmed.
When to stop using this line
First, the nature of the price action spanned by the anchors changes significantly, and the old line can no longer describe recent highs and lows. Second, price closes on both sides of the line multiple times, and the line lacks discriminating power for the current structure. Third, platform quotes or chart timeframes change, making the original drawing convention impossible to reproduce. Fourth, trading costs, spreads, or leverage risk make tiny chart crossings meaningless for execution. In these cases, instead of drawing more and more lines, keep the old records and redefine the research question.
A good review is not about finding the "correct trendline" every time, but about being able to clearly state which two points the line was drawn from, what evidence supports the break, and what evidence overturns it. Fidelity's chart education also reminds us that trends should be understood within the selected time range; short-term countertrend moves may just be pullbacks within a longer-term trend. This article does not use real-time XAUUSD data and does not promise that any particular rebound will be profitable. Leveraged trading can cause substantial losses.

MT4 EA troubleshooting guides →