Gold rising on the daily but falling on the hourly? Fix your planning timeframe first
Conflicting directions across timeframes can both be valid. Use instructional charts to explain the background, execution, and trigger layers, and avoid arbitrarily switching timeframes after a short-term setup fails.
Author: Thomas | Technical analysis experience | November 5, 2026
Summary: Gold looks like it is rising on the daily chart, yet the hourly chart keeps falling. Does that mean one of the charts is wrong? Different timeframes describe different scopes of observation, and both structures can exist at the same time. In practice, what is more likely to go wrong is switching timeframes at will after taking a position and relabeling a short-term plan that has already failed as a long-term bullish view. This article uses original instructional illustrations to explain how to fix the order of judgment; it does not involve intraday levels or real trading experience.
First ask yourself which segment you intend to observe
A pullback on a longer timeframe may appear as a complete downtrend structure on a shorter timeframe. Conversely, a bounce on a short timeframe may be only a local repair within a longer-timeframe decline. Before looking at a chart, first determine the holding period and structural layer your plan focuses on; only then can you understand what "trend alignment" is actually comparing. You cannot immediately infer that the market is abnormal just because the two charts have different colors.
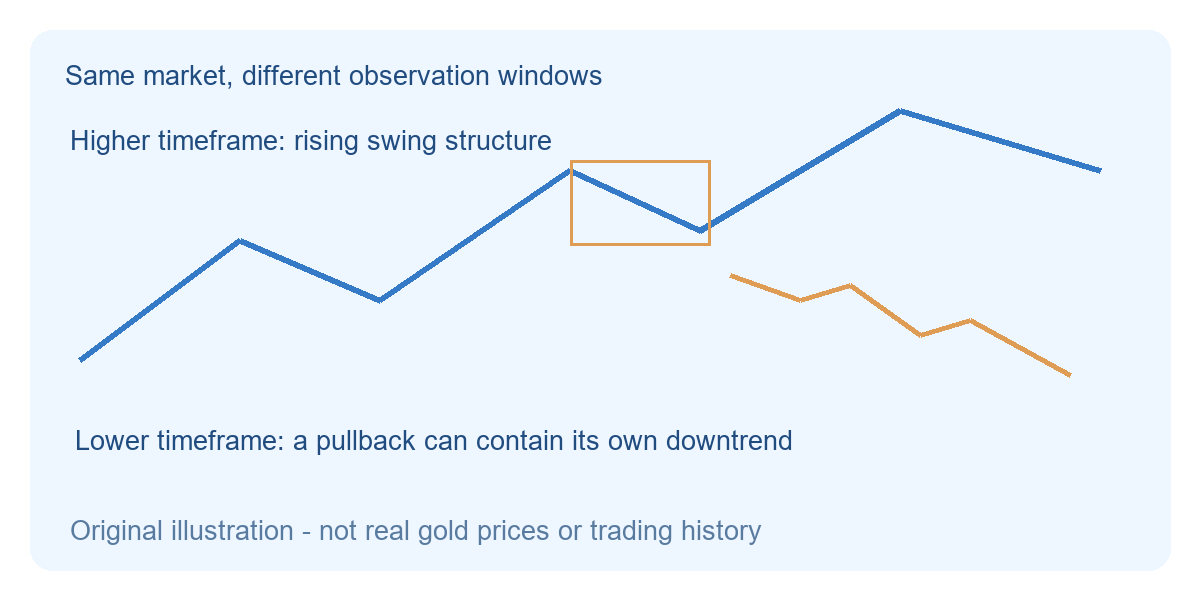
The blue line represents hypothetical higher highs and higher lows on a longer timeframe; after a pullback within the box is magnified, the orange line can form lower highs and lower lows. Both are structural illustrations only and do not use real gold prices, dates, or quote platforms. The purpose of the chart is to show that when the scope of observation changes, the same swing can be described differently, not to present a definite buy or sell path.
Establish a fixed three-layer record
Layer one records the background: choose a longer timeframe, mark the most recent identifiable major highs and lows, and state whether the current situation is closer to trend continuation, a pullback, or a range. Layer two records the plan: on the timeframe you intend to execute on, define what conditions make further observation worthwhile and which structural change would invalidate the original judgment. Layer three records the details: if a shorter timeframe is used, use it only to check trigger and execution conditions; it must not be allowed to continually replace the conclusions of the first two layers.
For example, suppose the longer timeframe still shows rising lows, while the execution timeframe has already broken below the most recent pullback low. At this point, you can retain the description that "the longer-timeframe background has not yet been damaged" while acknowledging that the short-term plan has failed. Whether to wait for a new structure, reduce participation, or remain flat must be decided according to the original plan; a bullish higher timeframe by itself does not automatically give a short-term position unlimited tolerance.
How to handle conflicts when they appear
First write the conflict down as a fact, rather than rushing to find a chart that supports your position. You can record: the longer-timeframe structure is still intact, the execution timeframe has weakened, and a new recovery confirmation has not yet appeared. Then return to the pre-set conditions and observe whether the execution timeframe can reclaim the broken level and form a higher low again. If confirmation never appears, waiting should not be interpreted as a signal having already appeared.
You can also set in advance that you will participate only when the background and execution timeframes are aligned in direction, but this is a personal filtering rule, not a law the market must obey. It may reduce trading and may also miss the early stage of a turn. There is no single optimal answer for different timeframe combinations; first keep the standard stable, then use records to evaluate the environments in which it applies. Constantly trying more combinations makes it easy to find seemingly perfect explanations after the fact.
The most common ways to fail
One is to switch to the daily chart after a short-term judgment fails, then switch to the weekly chart after another failure, without simultaneously reducing position risk. Another is to declare a major trend reversal upon seeing a bounce on a small timeframe while ignoring that the key structure on the longer timeframe has not changed. Still another is to look only at an unclosed longer-timeframe candlestick and mistake the intraday shape for a confirmed result. Observation records should note whether the candlestick has closed, to avoid using different standards in before-and-after comparisons.
If price gaps, the market enters disordered fluctuation, or different platforms' daily rollover time zones cause inconsistent candlestick structures, first verify the data standard and, if necessary, pause reliance on that combination. Multi-timeframe analysis can only help organize information; it cannot eliminate spreads, slippage, or judgment errors. Invalidation conditions and loss limits need to be determined before action and must not be quietly canceled when switching charts.

MT4 EA troubleshooting guides →