Gold quote volume expands but price won't rise—can you directly judge distribution?
Increased quote activity does not equal net selling outflow. Using non-real market illustrations, check data definitions, price progression, and subsequent confirmation to avoid writing volume expansion with stagnant price as a confirmed reversal.
Author: Thomas | Technical Analysis | November 12, 2026
Summary: The volume bars on a gold chart suddenly rise, but the price does not continue to rise, which is easily interpreted as "smart money distribution." This claim often exceeds what the data itself can prove. Especially when using quote counts as a volume indicator, you should first confirm what the volume bars measure, then observe price progression and subsequent recovery, to avoid directly equating increased activity with sellers winning.
When volume bars increase, what exactly is increasing
MetaTrader official documentation states that Volumes in the forex market usually count the number of price changes within the selected period. The platform also distinguishes between tick and real volume settings. For a specific gold CFD, you must check the data source and instrument description; you cannot judge from the bar appearance alone that it represents global traded ounces.
Even with real volume, a single volume bar does not directly equal net buying or net selling. Every transaction has two sides, and direction judgment requires additional definitions and data. Quote counts especially cannot be used to calculate the amount of capital inflow, nor can they be used to identify that a certain type of participant is distributing. This article discusses observation methods, not conclusions about any specific platform's market data.
Teaching scenario: volume bars rise, price remains in range
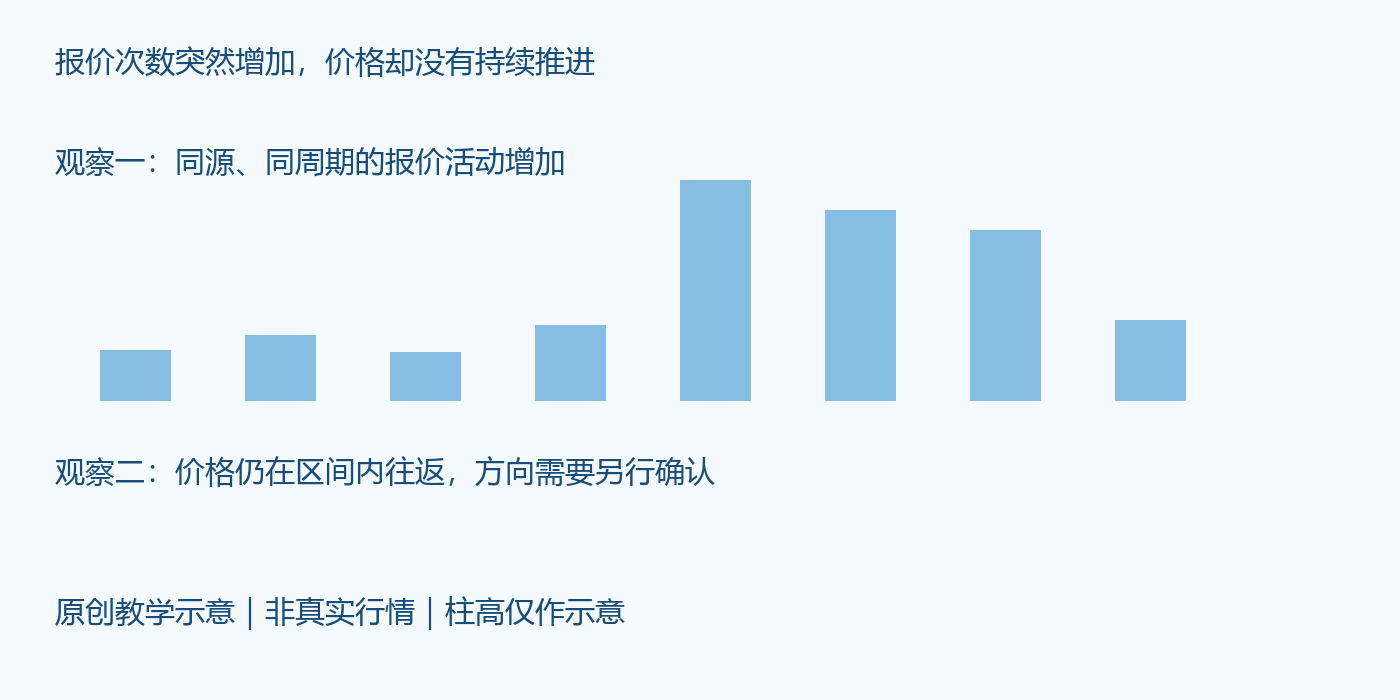
The image is an original teaching illustration, not real market data; bar heights have no actual traded quantity meaning. Assume that on the same platform and same period, several volume bars are higher than previous levels, but the price repeatedly approaches the upper edge of the range and then falls back, with closes still inside the range. This can only first be described as increased quote activity and insufficient upward progression.
Different paths may follow: the price may break above the upper edge after consolidation, may break below the range low, or may continue oscillating. The current volume bars alone cannot rule out any of these in advance. If all back-and-forth is attributed to hidden large-capital behavior, it is easy to obtain explanations that cannot be falsified and lose practical review value.
Compare similar periods first, then judge abnormality
First confirm the candlestick period, server time zone, indicator type, and whether the data is complete. A forming candlestick only counts part of the time and cannot be directly compared with a completed candlestick. Quote activity may also differ across trading sessions; try to compare with similar intraday periods rather than mechanically comparing a quiet period with the moment of a news release.
Then record the price range, body, and closing position corresponding to the volume bar changes. If the fluctuation range expands but the close returns to the original range, this only shows that back-and-forth contention is more obvious; if the price continuously leaves the range and holds during a retest, the basis for directional continuation increases. Volume bar color cannot replace these checks; indicator color may only indicate an increase or decrease versus the previous bar.
How a bearish hypothesis holds, and how it fails
A testable bearish scenario is: after multiple failed upward probes, the price breaks below a confirmed range low, the selected period closes below it, and a rebound also fails to recover it. At this point, volume bar changes can serve as background, but the key evidence is still the break in price structure and the failure to recover.
If the price recovers the range and further exceeds the previous upward probe high, the original bearish scenario needs to be withdrawn. If there is only an instant downward spike followed by a pullback, the possibility of a false breakout also cannot be ignored. The observation period and confirmation low should be fixed in advance; the area cannot be moved afterward to make the original judgment always appear correct.
A common failed judgment
A common mistake in teaching is: seeing increased quote volume but little gain and directly judging a decline, then later when the price completes consolidation and continues upward, renaming the same phenomenon "accumulation." Neither naming explained what evidence at the time could distinguish the paths. A more useful record is: whether the low was broken at the time, whether the range was recovered, which period was used for confirmation, and when to admit the hypothesis was invalid.
This is a hypothetical case, not personal trading experience. It reminds us to separate description from explanation: rising volume bars are a checkable data phenomenon, while "who is doing what" may just be speculation lacking evidence.
Applicable boundaries of the method
Data source switches, historical backfilling, quote anomalies, and session differences can all affect the comparability of volume bars. If these inputs cannot be confirmed, volume-price conclusions should be paused rather than adding more indicators to cover up the problem. Even if the structure is confirmed, gaps, widened spreads, and slippage may still change actual exit results. Risk budgeting must be independent of the narrative; no volume-price combination can guarantee direction or returns.

MT4 EA troubleshooting guides →