Does a Higher High Mean an Uptrend? Understanding Highs, Lows, and Structural Failure with Illustrations
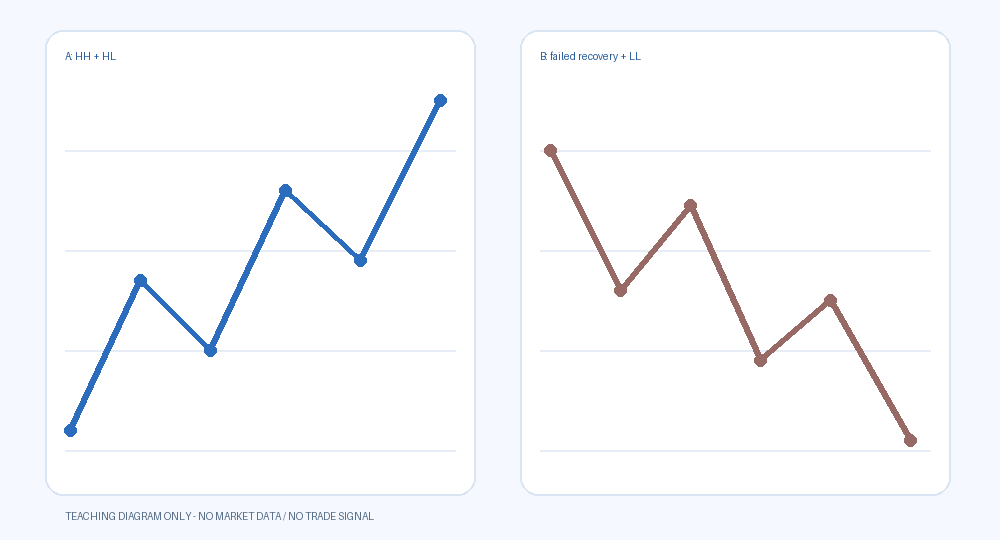
Two light-colored educational diagrams illustrate highs, lows, and failed recovery. First fix the pivot rules, then evaluate the structure.
Author: Thomas | Technical Analysis | October 11, 2026
A single bullish candlestick is not enough to prove that a trend has reversed. Observing the relative positions of highs and lows can help describe structure, but the timeframe and pivot rules must first be fixed. The two light-colored line charts, A and B, after the text are artificial educational illustrations, not real-time gold market data or live trading screenshots.
First define a pivot
Before analysis, clarify the instrument, source, timeframe, and method for identifying highs and lows. Pivots that have not yet been confirmed should be written as candidates and cannot be treated as facts known at the time. Different timeframes may produce different structures; a pullback on a smaller timeframe does not necessarily mean the larger-timeframe trend has ended.
Wicks and closing prices cannot be mixed arbitrarily, nor should the timeframe be changed to fit later results. This article does not provide pivot parameters universally applicable to all strategies; the method needs to be tested in independent records.
Figure A: Higher highs and higher lows
In Figure A, the blue line illustrates rising highs and rising pullback lows. HH means higher high, and HL means higher low. This only describes a hypothetical path and does not guarantee that the next segment will continue to rise.
After a new high, also observe whether the pullback maintains the structure and whether the rebound recovers the lost position. When the highest price appears, do not draw lows that have not yet occurred as already confirmed. The confirmation method used must be recorded in advance.
Figure B: Failed recovery and lower lows
Figure B illustrates that after a pullback, the rebound fails to recover the previous higher position, and the lows then continue to move lower. LL means lower low. It suggests reassessing the original upward assumption; it does not guarantee that a decline will necessarily follow.
The two figures have no real quotes or time scale and cannot be used to calculate target prices, returns, or entry positions. First find the highs and lows identified by the same rules, then explain the sequence of structure, and do not turn the direction of the line directly into a trading instruction.
Failure conditions must be written clearly first
One research framework is to first mark a confirmed reference low. If price persistently crosses that position, then recovery fails and lows continue to move lower, the assumption that the original structure remains intact needs to be reviewed. This is only a method example, not a universal stop-loss rule for all strategies.
Do not switch to a lower reference point every time it is crossed and then claim that the original judgment never failed. Keeping the first annotation, modification time, and reason is the only way to distinguish reasonable updates from after-the-fact selection.
Structure does not replace execution and costs
Even if the research structure is clear, spreads, gaps, and actual fills still need to be checked separately. Reference points are not order prices guaranteed to be filled, nor can they be directly converted into account risk amounts. When synchronized data is unavailable, do not fabricate USD or return changes to confirm direction.
When charting real market data, note the source, price time, and timeframe, and keep the conventions consistent. When data is insufficient, use clearly labeled educational charts and do not fabricate screenshots to add persuasiveness.
Keep a complete observation record
Save the rules, candidate and confirmed positions, failure conditions, and subsequent results, while also retaining invalid and failed samples. Showing only successful segments makes structural judgment appear easier than it actually is, and no fixed win rate should be published based on that.
This article has no real account performance or profit guarantee. Leveraged trading may cause significant losses. The content is for technical research and education and does not constitute a buy or sell instruction. The illustrations only explain concepts and cannot predict future prices.
MT4 EA troubleshooting guides →