Why should gold support and resistance be drawn as zones rather than a precise line?
Price often repeatedly tests around prior highs and lows. Use a schematic to explain how to define an observation zone, distinguish a pierce from a valid breakout, and write down invalidation conditions in advance.
Author: Thomas | Technical analysis experience | October 26, 2026
On the same gold chart, one person draws resistance at the top of the highest wick, another draws it where several candlestick closes cluster, and each then claims that 'price reverses when it touches the line.' The problem is not necessarily whose drawing is right or wrong, but that the market does not always turn neatly at some exact number. Support and resistance are better treated as zones where price reaction needs to be observed, not as walls guaranteed to hold. This article discusses a chart-reading method and does not use real price levels from any given day; all paths in the figures are teaching schematics.
Where zones come from
First choose the timeframe used for trading decisions, then find prior highs, prior lows, or range boundaries in completed candlesticks where reactions repeatedly occurred. If multiple highs differ slightly, the main wick endpoints and close clusters can be combined into a narrow zone rather than forcing them to share the same price level. CME's technical analysis educational material also notes that support and resistance do not always hold exactly at one price and are better viewed as zones.
When drawing a zone, record its source at the same time: which highs and lows, on what dates and timeframe, and the basis for the zone width. If the zone is so wide that it covers almost all recent fluctuation, it loses discriminating power; if it is so narrow that it contains only the extreme of one wick, normal tests are easily mislabeled as breakouts. When charting platforms, broker quotes, and server time zones differ, candlestick highs and lows may also differ; boundaries from two platforms must not be stitched together into a seemingly precise 'consensus price.'
Illustration: two outcomes for the same resistance zone
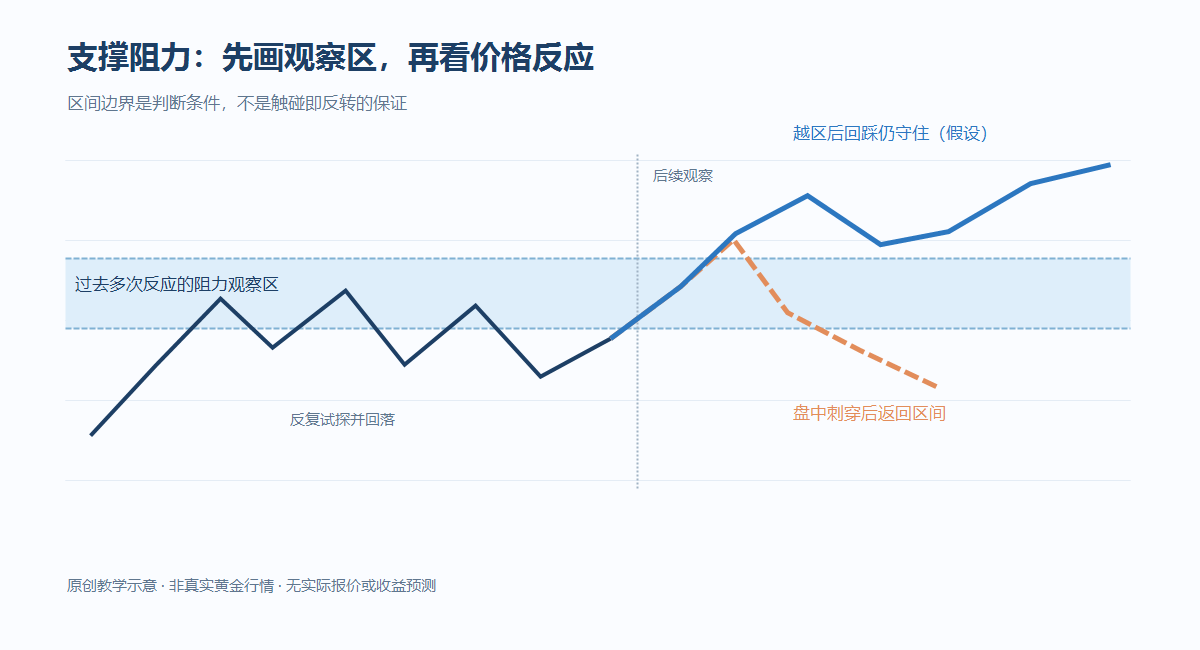
The light blue band in the figure represents an observation zone from several past rallies that later pulled back. On the left, when price reaches the zone, one wick briefly passes through the upper edge, but the completed candlestick returns inside the band; an intraday pierce alone does not mean the original resistance has failed. The right side shows another hypothetical path: a completed candlestick moves beyond the zone, and the subsequent retest does not fall back inside the band, which is when there is reason to discuss that 'old resistance may turn into support.' This role change is a condition to be verified, not a rule that every breakout will fulfill.
Write observations as revocable conditions
If you lean toward the zone still limiting upside, write down the counterevidence: if price not only moves beyond the upper edge but also remains outside the zone for consecutive periods on the chosen timeframe, and the retest holds, the original resistance judgment should be revoked. If you lean toward the breakout continuing, write down another piece of counterevidence: if price quickly returns inside the zone and the rebound cannot reclaim the upper edge, the breakout interpretation needs to be downgraded. Both hypotheses can be prepared in advance, but the zone should not be moved after the outcome appears to make excuses for the original judgment.
The order of observation also matters. First see how price approaches the zone: is it a sustained strong push, or repeated failed rallies; then see whether the candlestick touching the zone has completed; finally see the subsequent behavior after leaving the zone. The touch itself is not a trading instruction; wicks, closes, and retests provide different levels of evidence. If there is not enough time to wait for confirmation, acknowledge that information is insufficient rather than using 'high probability' to cover the gap.
When a zone loses value
Major data and sudden news can make price cross past reaction zones quickly. If the market enters a sustained one-way trend, repeatedly using old resistance to guess tops may also misjudge strength as a pullback every time. On the other hand, if price crosses up and down around the zone for a long time, the zone can no longer effectively distinguish the advantage between buyers and sellers, and the structure should be re-marked rather than continually stacking wider color blocks.
For XAUUSD, also consider bid/ask, spread, and slippage: on the chart it may look as if the boundary was just touched, but the actual order may not fill at that price. In review, keep valid, invalid, and no-reaction cases together, and record the platform, timeframe, original zone-drawing time, and trading costs. Support and resistance zones can help clarify 'where to observe,' but cannot guarantee that 'price will necessarily reverse here'; position size and risk budget still need to be calculated independently.

MT4 EA troubleshooting guides →