October 19 Gold Strategy Watch: Breakouts, Pullbacks, and Invalidation Conditions at Both Ends of the Range
Based on the bid price of USD 4171.70 at 09:19 Beijing time and the source range of 4156.70–4188.60, the accompanying chart illustrates candidate bands at both ends, distinguishing touches, confirmations, and invalidation.
Author: Thomas | Strategy Watch | October 19, 2026
This article is based on a gold reference snapshot at 09:19 Beijing time and examines breakout and pullback conditions at both ends of the source range. The zones below are candidate observation bands built around verified range endpoints; they cannot yet be regarded as strong support or strong resistance that has been tested multiple times, nor are they definitive buy or sell instructions.
Quote Time and Scope of Application
The Kitco spot gold body text states New York, October 18, 21:19 EDT, corresponding to 09:19 Beijing time on October 19. Bid 4171.70, ask 4173.70 USD per troy ounce; the source shows a range of 4156.70 to 4188.60. The time at the top of the page is 21:20; this article uses the price time in the body text as its cutoff.
Compared with the 08:31 morning report bid of 4173.80, the latest snapshot is USD 2.10 lower and remains within the same source-displayed range. This only indicates the difference between two observations and cannot be used to infer the full path in between. The source range is not the completed intraday high and low for Beijing time, nor does it equal the full-week range. XAUUSD quotes, spreads, and daily rollover times may differ across platforms; users should first verify differences on their own platform.
How the Candidate Observation Bands Are Derived
The area near 4188.60 above is organized into the 4185–4190 observation band, and the area near 4156.70 below is organized into the 4155–4160 observation band. The range endpoints come from the quote page; the band widths are rounded ranges used in this article for ease of observation, not statistically calculated confidence intervals, and no claim is made that real order accumulation exists.
At present, 4171.70 is between the two bands, and this position alone does not provide sufficient basis for choosing a direction. Because verifiable continuous candlestick data has not been obtained, this article does not claim that a double bottom, volume breakout, or multiple retests have appeared. The chart below only shows price position and candidate bands and does not draw an unverified market trajectory.
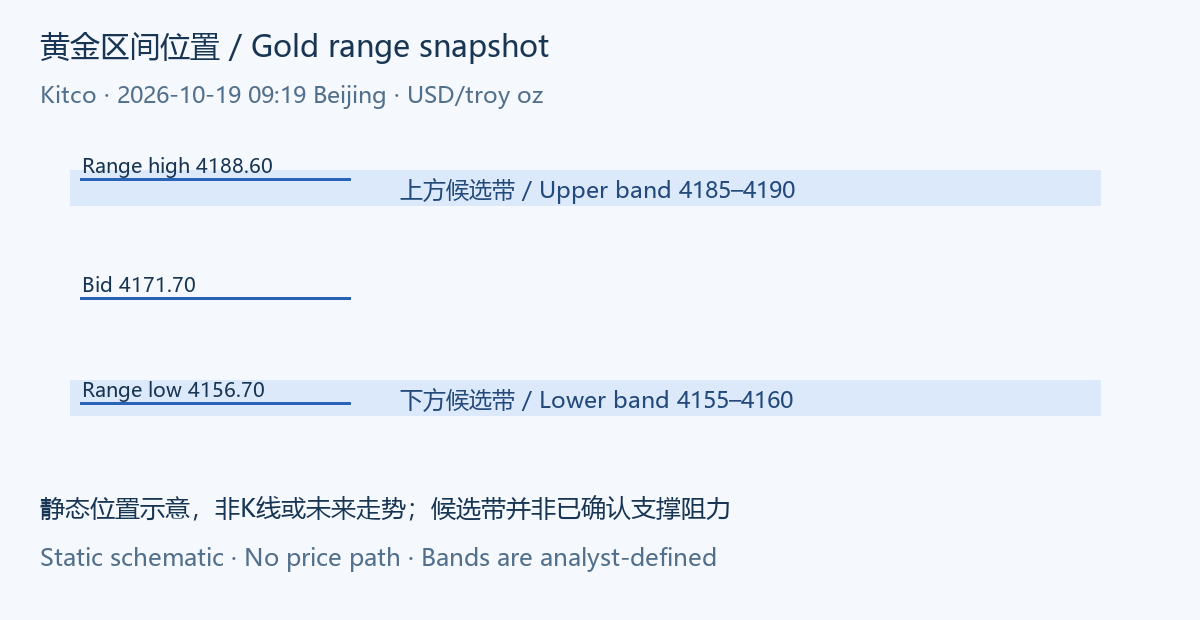
Illustration based on the Kitco snapshot at 09:19 Beijing time; price unit is USD per troy ounce. The observation bands are constructed by this article; the chart contains no forecast of future paths.
Scenario 1: Whether the Upper Edge Can Hold After a Breakout
If subsequent quotes move above 4190, first check whether continuous quotes on the same platform and the close of a complete period remain above the upper band, then observe whether price can stay near that band on a pullback. A 15-minute period may be chosen in advance as a consistent observation basis, but this is only a research rule and does not mean that 15-minute confirmation has guaranteed effect.
If price only briefly moves above and then falls back below 4185 and cannot recover within the chosen complete period, the upside breakout continuation scenario is invalidated. If there is only an instantaneous price spike, an abnormal widening of the spread, or a different market data source, the condition is not considered triggered for now. Without a new verifiable upside structure, this article does not arbitrarily add target prices.
Scenario 2: Support or Failure After a Pullback to the Lower Edge
If price pulls back to 4155–4160, observe whether it can stop declining and return above 4160 within the chosen complete period. This can only serve as a condition for a candidate support scenario; touching the lower band itself is not confirmation of a rebound, still less a reason that one must buy.
If subsequent complete periods remain below 4155 and price returns to the lower band but cannot reclaim 4160, the original lower-edge support scenario is invalidated, and range data should be collected anew rather than endlessly lowering so-called support. Conversely, if price quickly recovers above 4160 after breaking down, that weakens the judgment of downside continuation. One cannot simply select the single quote that favors the original view.
Waiting Within the Range Also Requires Rules
When price is still between the two bands, the focus should be on recording whether conditions appear rather than repeatedly guessing the next candlestick. The slight pullback in the morning snapshot is not enough to declare a bearish trend shift, and the intraday rise shown by the source is not enough to confirm a bullish trend shift. Between market scenarios and actual order placement lie transaction costs, account risk, and execution conditions.
If the subsequent range clearly expands, important news changes the price structure, or quote differences across platforms widen, this set of morning candidate bands needs to be reassessed. When updating, keep the original record and mark the new time; the day's strategy watch maintains only this article and does not use additional articles to obscure invalidation judgments. Leveraged trading may cause substantial losses; this article does not promise returns.

MT4 EA troubleshooting guides →