Should You Sell Gold Just Because the Stochastic %K Reaches 80? Understand the Closing Position First
The stochastic indicator reflects the relative position of the closing price within its recent range; 80 is not an automatic sell button. Use a teaching formula to understand raw %K, smoothing differences, and the environments in which it fails.
Author: Thomas | Technical Analysis | November 12, 2026
Summary: When the stochastic indicator rises above 80, it is usually called overbought, but that does not mean the next candlestick is bound to fall. To use it correctly, first understand that the value represents the position of the closing price within the recent high-low range, then confirm the version, timeframe, and price structure. This article answers only one question: can you sell directly when %K reaches 80?
How raw %K is obtained
The stochastic oscillator compares the current closing price with the highest and lowest prices in a selected window. The common calculation for raw %K is: current closing price minus the window low, divided by the window high minus the window low, then multiplied by 100. The parameter 14 usually means 14 candlesticks, not necessarily 14 days. If the denominator is zero, check how your platform handles it; do not treat it as a normal signal on your own.
Raw %K and the smoothed slow %K must not be conflated. %D is generally a line obtained by further averaging %K; the specific averaging method and slowing parameter depend on the software documentation. Both Fidelity and MetaTrader educational materials distinguish fast and slow processing; smoothing details may differ across software, and the same "14" is not enough to guarantee that the two lines are identical.
What 80 means: a formula
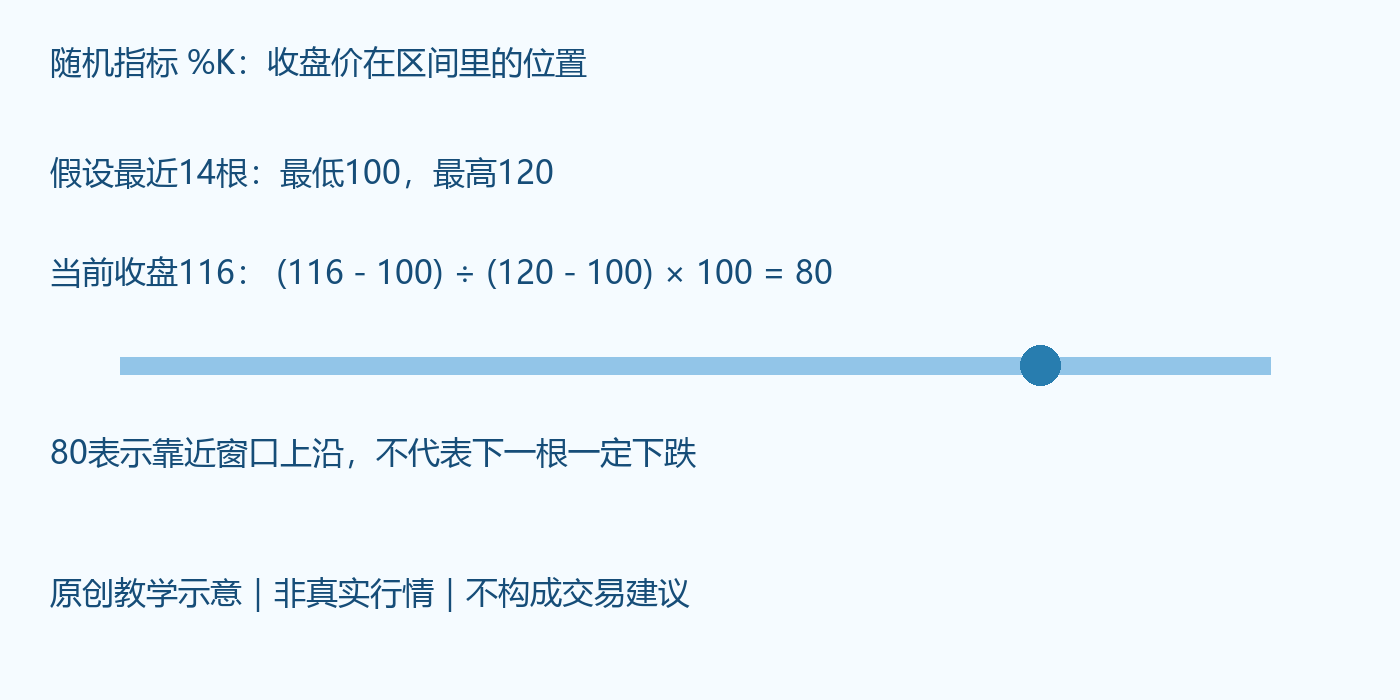
Suppose the lowest price of the last 14 candlesticks is 100, the highest is 120, and the current close is 116; raw %K equals 80. All numbers in the figure are teaching assumptions, not real gold market data. This result only indicates that the closing position is at 80% of the window from low to high; it does not mean the probability of a rise is 80%, nor that 80% of traders have bought.
If subsequent closes continue to move toward the upper part of the range, the indicator can remain in the high zone. In a strong trend, price continuing to rise and the indicator remaining overbought can occur at the same time. Therefore, treating 80 directly as a sell switch misreads a position description as a reversal forecast.
How to check the signal step by step
First fix the instrument, quote platform, and candlestick timeframe, then record the indicator version, lookback length, slowing parameter, and %D averaging method. Compare values using closed candlesticks; a forming candlestick will change the closing position, and an intraday crossover may disappear before the close.
Next, identify the price environment. If highs and lows keep rising, the indicator staying high is more likely to reflect strength, and you cannot conclude a decline merely because it exceeds 80. If price is in a relatively clear wide range, a pullback from the high zone can be used as an observational clue, but you still need to consider rejection at the upper boundary of the range, the breaking of a local low, and subsequent rebound behavior.
Finally, write down the conditions under which the judgment fails. For example, suppose price weakens after being rejected at the upper boundary; if it then re-crosses the previous high and holds, the original bearish judgment must be withdrawn. This is a conditional observation example, not a fixed order rule, and it does not mean that waiting for a certain crossover will eliminate risk.
Where common mistakes lie
The first definitional error is treating the stochastic indicator as RSI. The two have different inputs and algorithms, and the same value does not mean the same thing. The second mistake is directly comparing strength using 80 across different timeframes; when the observation window changes, the context of the value changes too. The third mistake is cherry-picking historical episodes of successful pullbacks while ignoring failed signals caused by sustained rises in the high zone.
Window rolling itself also changes the indicator. After an old high or old low leaves the sample, raw %K may change noticeably even if price has changed little. When reviewing, check the numerator and denominator rather than interpreting every turn as a sudden change in capital direction. Smoothing of the slow line can also introduce additional delay; do not treat a retrospectively smoothed pattern as real-time foreknowledge.
Applicable conditions and risk boundaries
The stochastic indicator is usually easier to interpret in wide ranges or slower trends; in violent one-sided markets, it may repeatedly give premature contrary clues. Gaps, liquidity changes, and stale quotes also reduce the reliability of the inputs. If the parameters and historical data cannot be confirmed, pause the comparison first.
The indicator can help describe the environment but cannot guarantee an exit price. Spreads, slippage, and existing account exposure all need to be included separately in the risk budget. After seeing 80, the most valuable next step is to check the price structure and calculation definition, not to immediately turn the value into a directional promise.

MT4 EA troubleshooting guides →