Should You Short Gold When RSI Exceeds 70? Illustrating the Difference Between Overbought and Reversal
Using the same set of hypothetical prices and a 14-period RSI calculation chart, explain high-level momentum, price conditions, and invalidation records, to avoid treating indicator values as reversal probabilities.
Author: Thomas | Technical Analysis | October 15, 2026
Seeing RSI on a gold chart exceed 70, some people will immediately look for shorting opportunities. But "the indicator is at a high level" and "price is about to reverse" are two different judgments. Today, using an original educational chart, we explain: strong momentum can coexist with continued price advances; indicator signals need to be combined with price evidence and cannot directly replace trading conditions.
What RSI Describes and What It Does Not
RSI is a momentum oscillator, typically ranging from 0 to 100, organizing information based on the relative strength of gains and losses over a period of price changes. 70 and 30 are common overbought and oversold reference levels, not boundaries at which price must turn. In strong trends, the indicator may remain in extreme zones for extended periods.
It does not directly tell you the remaining upside, the direction of the next candle, or the win rate of a trade. Interpreting a value of 75 as "a 75% probability of decline" mistakes the indicator scale for probability and lacks statistical basis.
Chart: High-Level Indicator Can Accompany Continued Advances
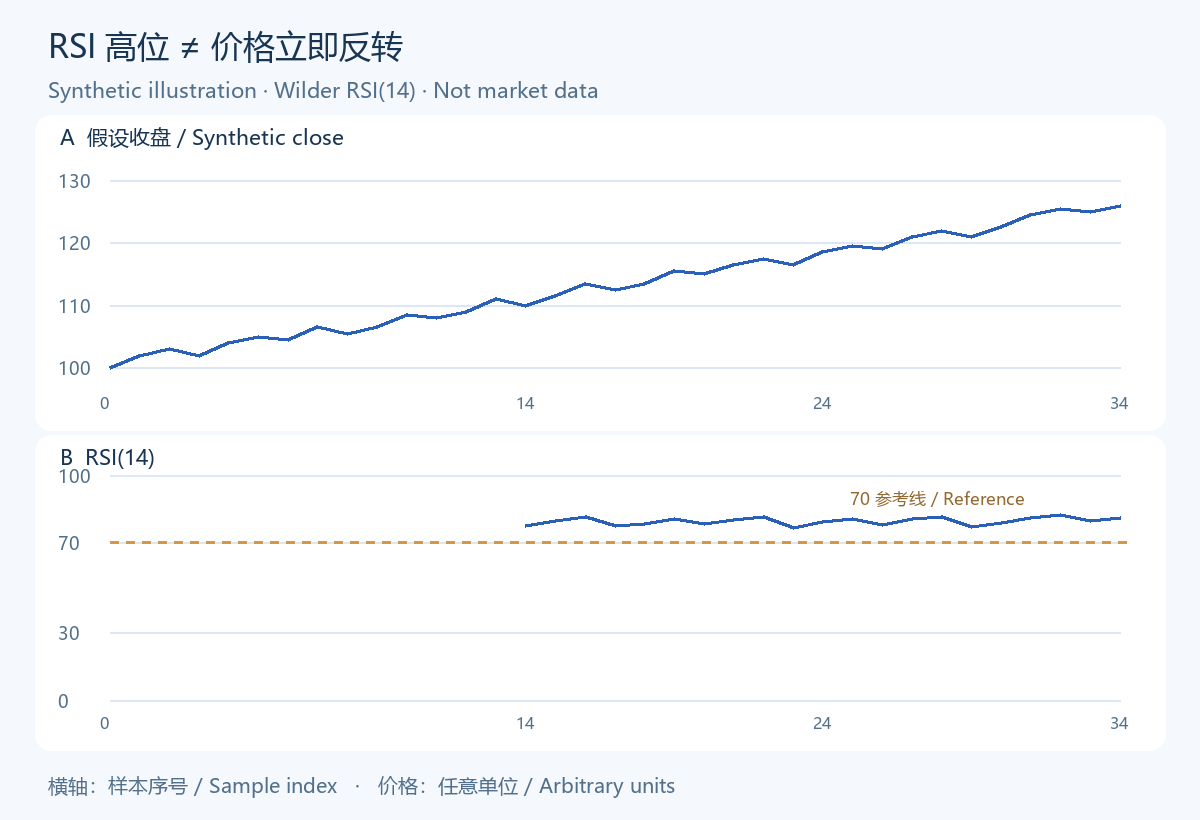
Chart A is a set of artificially set closing prices, in arbitrary units, with no real trading dates, and is not XAUUSD market data. Chart B uses the same series to calculate a 14-period RSI: first initialized with the average gain and average loss of the first 14 price changes, then updated using Wilder smoothing.
The horizontal axis is the sample number, with the two charts aligned vertically. The 70 dashed line in Chart B is only used to identify the reference zone; Chart A shows that in this educational sample, when the indicator was above 70, price still continued to advance. This example only refutes the absolute claim that "above 70 must fall"; it cannot prove that chasing gains is always profitable, nor does it represent market frequency.
Look at Price First, Then Assign Responsibilities to the Indicator
Before observing, state your question: are you identifying momentum within a trend, or studying a turn at the edge of a range? The same value placed in different contexts cannot automatically lead to the same conclusion. Whether price continues to form new highs and whether pullbacks break the predefined structure need to be recorded independently.
You can use RSI as a reminder to return to the price chart for verification; do not let it simultaneously bear the four responsibilities of context judgment, entry, exit, and risk amount. The vaguer the responsibilities, the easier it is to temporarily switch interpretations when the market moves unfavorably.
Divergence Also Requires a Clear Comparison Object
The so-called divergence requires first determining which two price turning points to compare, and the corresponding indicator turning points in the same period. You cannot select a price high from long ago while using an indicator peak from another window, and then interpret the inconsistency as a strong signal.
Even after completing a consistent comparison, you can only record that price and momentum behaved differently; you cannot skip reversal conditions and directly declare a direction change. If price continues to advance and the predefined reversal evidence does not appear, the judgment should remain pending confirmation, rather than continuously shifting the comparison point.
Write Clearly How Assumptions Fail
Educational observations can be recorded as follows: after the indicator enters a high zone, first mark a reminder; only when pre-specified price conditions appear, further discuss a turn. If price continues to advance, or the so-called break quickly recovers, re-examine the reversal hypothesis.
This is not a validated trading system; there is no unified waiting number of bars, entry price, or stop-loss distance. The role of invalidation conditions is to limit the scope of interpretation, avoiding claiming that the same indicator has predicted in advance regardless of whether the market rises or falls.
Keep Samples Without Reversal During Review
When preparing samples, fix the instrument, quote source, candle period, RSI period, and calculation method, while preserving cases of rises, falls, and sideways movements after triggers. Only capturing charts of successful reversals will hide samples of sustained high levels and repeated crossings. To compare methods, you also need to predefine observation length, outcome criteria, and cost conventions.
This article does not provide current gold levels, nor does it use real account performance. The charts are reproducible educational illustrations of calculations and cannot be taken as proof of backtest returns. Leveraged trading can cause significant losses; indicators help describe existing information and do not guarantee future direction.
MT4 EA troubleshooting guides →