Should You Sell Gold Just Because RSI Exceeds 70? How to Judge Overbought Persistence and Reversal Confirmation
RSI 70 is a momentum observation line, not an automatic sell point. Use original illustrative diagrams to explain overbought persistence in trends, divergence misjudgments, and reversal confirmation steps.
Author: Thomas | Technical Analysis | November 3, 2026
Summary: When gold RSI rises above 70, is it an immediate signal to go short? No. RSI reflects the relative strength of recent gains versus losses; 70 is a common observation line, not a switch that requires price to turn down. This article only answers "why overbought conditions may persist" and provides check steps that do not rely on hindsight explanation. The images are original teaching illustrations, not real market data.
What RSI 70 Actually Means
RSI is a momentum indicator between 0 and 100. The common setting proposed by Wilder is 14 periods; 70 and 30 are commonly used to observe relatively strong and relatively weak zones. It compares the average magnitude of upward and downward changes over a period and does not measure the "true value" of gold. The same value may represent different environments in a trending advance and in narrow-range oscillation. Therefore, RSI reaching 70 alone cannot prove that the gold price has topped.
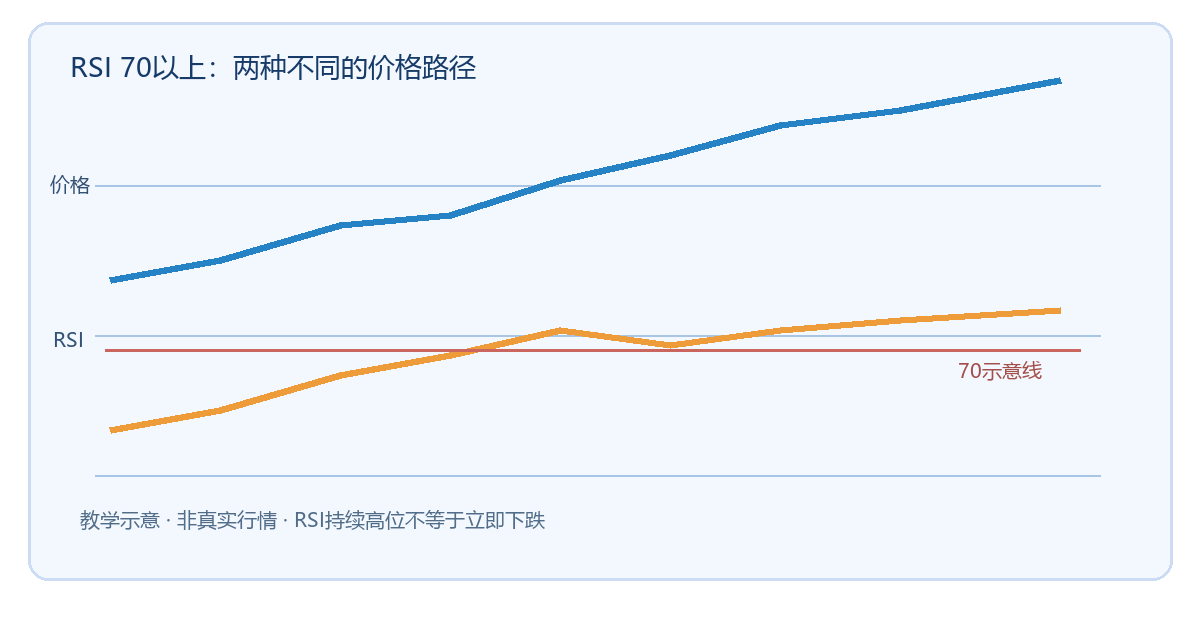
In the figure, the blue line represents a hypothetical price that keeps rising, and the orange line represents RSI staying at a high level after crossing 70. Both lines are only conceptual paths and do not use any platform quotes. It shows that the indicator first enters the "overbought" zone while price may still continue along the original trend. Selling solely because of the first crossing may expose you to adverse fluctuations before the trend has ended.
Three Steps to Judge Whether a Reversal Is Worth Studying
Step one: define the environment first. Observe the structure of highs and lows and the higher timeframe: does price continue to make higher highs, and do pullbacks still hold the previous key low? If the structure is intact, a high RSI can be a sign of strong trend. If price has long been moving back and forth within a range, the area around 70 is more suitable as a prompt that "price is near the upper edge of the range and reversal evidence needs to be sought." Environment judgment must precede signal judgment; otherwise, it is easy to work backward from a completed chart to justify reasons.
Step two: look at how RSI leaves the high level, not merely whether it touches 70. You can record whether it falls back below 70, whether price breaks below a pre-marked short-term structural low, and whether the subsequent rebound lacks strength. These conditions do not need to be mechanically combined into a sure-win rule; their role is to give "possible weakening" verifiable evidence. If RSI briefly drops back below 70 but price quickly returns to the high, the original reversal hypothesis should be reassessed.
Step three: fix the timeframe and sample criteria. RSI 70 on M15 and RSI 70 on the daily chart are not the same observation window and cannot be mixed in backtesting. First note the gold instrument, quote platform, candlestick timeframe, RSI parameters, and observation date, then record the price path over a number of candlesticks after the overbought condition. Keep both successful and failed cases to avoid selecting only charts that eventually fell.
Divergence Also Cannot Replace Price Confirmation
When price makes a new high while the RSI high is lower, this is often called bearish divergence. Divergence indicates that upward momentum may be weakening; it does not specify when price will reverse. In a strong trend, price may continue to make new highs while divergence continues to widen. To evaluate it, first define how the two highs are selected, how many candlesticks apart they are, what conditions count as divergence invalidation, and record whether structural damage actually occurs afterward. "Divergence" without predefined criteria easily becomes cherry-picking charts after the fact.
Common Mistakes and Invalidation Conditions
Common mistakes include: treating 70 as an automatic sell point; ignoring spread widening and gaps around major data releases; using small-timeframe signals to negate a higher-timeframe trend; and continually moving stop losses after a loss to prove that the indicator "will eventually be right." If price keeps making higher highs and higher lows, or first breaks a short-term low and then quickly recovers it, a simple reversal judgment lacks support. Indicators are based on price changes that have already occurred and cannot guarantee future direction. When used for gold CFDs, spread, overnight financing costs, and leverage risk must also be considered. This article is for technical analysis education only and does not constitute trading advice or a guarantee of returns.

MT4 EA troubleshooting guides →