Should You Sell Gold When RSI Exceeds 70? Understanding the Difference Between Overbought and Strong Trends
RSI above 70 indicates strong recent upward momentum, not an immediate reversal. Original light-colored educational charts illustrate the judgment steps, common misuses, and invalidation conditions.
Author: Thomas | Technical Analysis | October 30, 2026
When searching "should you sell gold when RSI exceeds 70," the most common result is a simplified conclusion: above 70 is called overbought, so you should go short. This only remembers the traditional threshold while ignoring what the indicator itself means. RSI measures the relative strength of price increases versus decreases over a period, with values between 0 and 100. Above 70 is usually called the overbought zone, but "recently rising fast" does not equal "the next candle will definitely fall."
First, look at what 70 represents
RSI was proposed by J. Welles Wilder, and common settings use 14 periods. Fidelity's indicator explanation lists above 70 and below 30 as traditional overbought and oversold references, while noting that in strong trends the indicator may remain in these zones for a long time. Therefore, 70 is a ruler that reminds you to observe momentum, not a switch that guarantees price reversal. Different parameters and chart timeframes change the reading: a daily RSI and a 15-minute RSI both at 72 describe completely different time ranges.
When reading, first fix the instrument, timeframe, and parameters, then see whether the price itself still maintains higher highs and lows. If the structure continues to move up, RSI staying above 70 may instead indicate that the trend still has strength; if price makes a new high but quickly falls back into the original range and RSI also weakens from a high level, then there is reason to further examine whether momentum is fading. The two situations cannot be distinguished by a single reading alone.
Use a chart to understand why overbought can persist
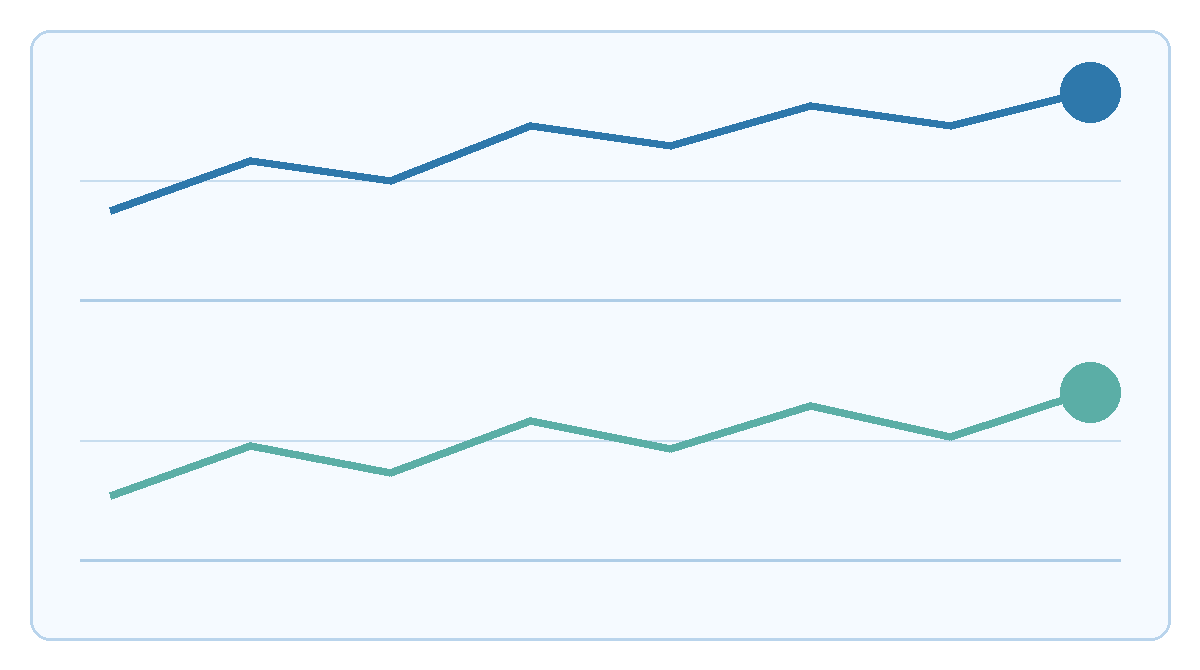
The blue line above illustrates price gradually rising, and the green line below illustrates RSI overall remaining relatively strong. The chart only explains the indicator relationship; the vertical axis is not a dollar quote, the curves are not real gold market data, and the specific 70 threshold position is not drawn. What it expresses is: when price is rising, even if RSI enters a high zone, it can continue to remain strong. Treating the first position where the value exceeds 70 as a fixed selling point can easily lead to going against the trend too early.
Four steps for practical analysis
Step one: confirm that you are using the gold quote from the same trading platform and the same timeframe, and record the RSI parameters. Step two: first judge the price structure: rising, falling, or range-bound. In a clear upward phase, high RSI is first treated as a momentum clue; in a repeatedly oscillating phase, touching 70 back and forth may be more worth observing at the range edges. Step three: wait for price to provide independent evidence, such as a failed breakout, a return to the original range, or a break of the low structure. Step four: set invalidation conditions for the original judgment: if price continues to raise highs and lows and RSI strengthens again, you cannot insist on the old conclusion that "above 70 must fall."
There is no fixed number of confirmation bars that suits everyone. The shorter the timeframe, the more noise; waiting too long may miss part of the move. Therefore, record clearly in your notes the chosen timeframe, confirmation rules, and failure samples, rather than adjusting parameters afterward to look correct.
Common mistakes and risks
Treating RSI above 70 directly as a short instruction is the first mistake; confusing a high RSI with a bearish divergence is the second mistake. A bearish divergence also requires comparing two corresponding turning points in price and the indicator, and cannot be judged from a single reading. The third mistake is ignoring spread during news periods, slippage, and differences between quote sources; a signal appearing on the chart does not mean you can execute at the expected price. RSI alone cannot prove that gold price has topped, and even less can it guarantee returns. This article is indicator education and does not constitute trading advice; leverage may amplify losses.

MT4 EA troubleshooting guides →