What does gold RSI crossing above 50 mean? First look at how gains and losses are calculated
Use an original worked example to explain the RSI 50 midline, distinguishing average gains and losses, price structure, and confirmation conditions after the cross.
Author: Thomas | Technical Analysis Tutorial | November 10, 2026
Summary: Gold RSI crossing above 50 means that, under the indicator's calculation method, the smoothed average upward magnitude has just exceeded the average downward magnitude. It gives the momentum change of a segment of historical prices. To judge whether this change can continue, it is also necessary to check the close, price highs and lows, and the prevailing trend or range.
Why 50 is the midline
The RSI proposed by Welles Wilder converts the ratio of average upward magnitude to average downward magnitude onto a scale of 0 to 100. In calculation, the changes between adjacent closing prices are first split into two groups. On an up move, the increase is recorded in the up group and the down group is recorded as zero. On a down move, the absolute value of the decline is recorded in the down group and the up group is recorded as zero. After smoothing each separately, divide the average upward magnitude by the average downward magnitude to get RS, then calculate RSI = 100 - 100 ÷ (1 + RS). When both are positive and equal, RS is 1 and RSI is exactly 50.
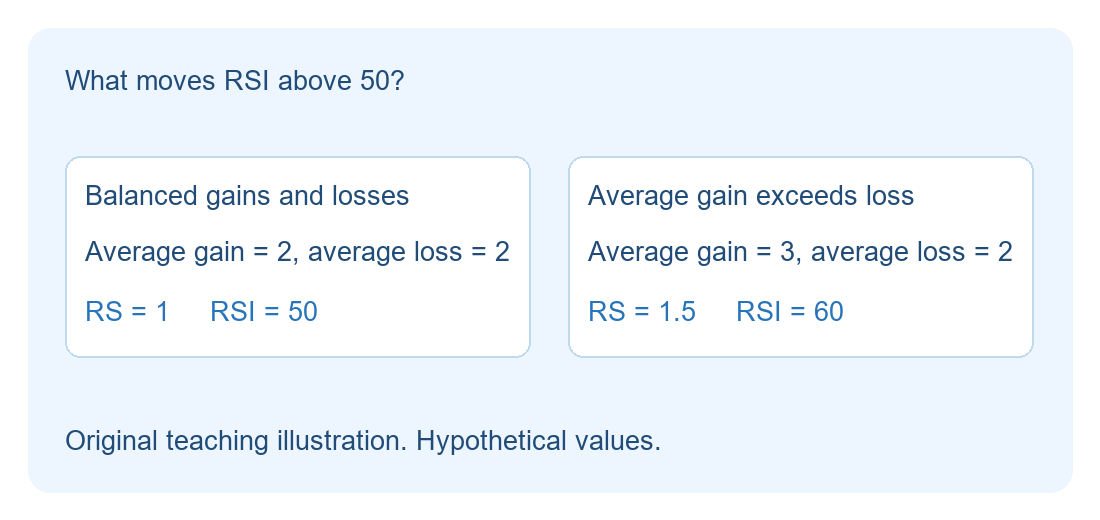
Suppose both smoothed values are 2; RSI is 50. If the next reading corresponds to an average gain of 3 and an average loss of 2, RS is 1.5 and RSI is 60. The values are only for demonstrating the formula. Crossing above 50 compares smoothed magnitudes; sometimes a few larger gains can outweigh many small declines, so it cannot be understood as more than half of the candles being up candles.
How to verify a cross on the chart
First fix the same quote source, instrument, timeframe, and parameters. A common parameter is 14 periods; on an hourly chart that is 14 hourly candles. The Wilder method smooths recursively after the initial average; directly taking a simple average of the most recent 14 bars repeatedly may produce different readings. Before comparing platforms, check the algorithm, historical sample, and closing time. In extreme cases the average decline is zero; if the average gain is greater than zero, the common result is 100. When both groups are zero, check how the platform handles it.
Next, compare only the RSI of two consecutive completed candles on the same timeframe. If the previous one is 48 and this one closes at 52, a cross can be recorded. If it spikes to 52 intraday and closes back at 48, it should be recorded as an intraday test according to the rule chosen in advance. Keep the time and closing status so that samples can be compared using the same standard during review.
What to look at after the cross
First see whether price has broken through a recently identifiable local high, and whether a higher low appears after a pullback. If RSI crosses above 50 while price is still oscillating repeatedly within a narrow range, there is less evidence of trend continuation. Only if price leaves the range and maintains a new structure after a retest is there one more piece of price evidence independent of the indicator reading. Waiting for this step makes the judgment later and may miss moves without a retest.
If a continuation hypothesis has already been written down and RSI subsequently falls back below the midline, and price breaks below the pullback low used for confirmation, it should be reassessed. If only the midline is seen switching back and forth, one can keep observing the range and wait for the structure to become clearer. A common mistake is to change parameters afterward or treat intraday readings as closing values in order to make this signal look valid. Quote interruptions and sharp fluctuations in the data window can also affect the indicator; actual trading also requires checking spreads, slippage, and affordable losses.

MT4 EA troubleshooting guides →