How to Read RSI Divergence in Gold? Identifying Bearish Divergence and Invalidation Conditions with an Illustration
Is it bearish divergence when price makes a new high but RSI does not? Use an original educational chart to clearly explain corresponding turning points, confirmation steps, common misjudgments, and invalidation conditions.
Author: Thomas | Technical Analysis | October 29, 2026
When gold price makes another new high while RSI does not, some people immediately treat it as a short signal. This kind of "bearish divergence" is worth noting, but it only shows that the indicator readings corresponding to the two advances are different. Whether price is truly reversing still requires looking at subsequent structure; in a strong trend, divergence may appear multiple times while price continues to rise.
What RSI Divergence Actually Compares
RSI is a momentum indicator calculated based on upward and downward changes over a period of time, with readings between 0 and 100. The common default period in MT4 is 14. So-called bearish divergence means that, within the same instrument and the same chart timeframe, price forms a second higher confirmed high, while the RSI peaks corresponding to these two highs are lower. Bullish divergence is the opposite: price forms a lower low, while RSI forms a higher low.
What is compared here is two corresponding turning points, not arbitrarily pairing the highest price point with RSI's low on any given day. First fix the rules for identifying turning points, then go back and check the chart, so as to reduce hindsight point-picking. If the RSI period and quote platform change, the chart may also change, and highs and lows under different settings cannot be mixed.
Four Steps to Check Bearish Divergence
Step one: fix the XAUUSD quote source, candlestick timeframe, RSI parameters, and observation window. Step two: select only two price highs that have already formed, and record the RSI peak corresponding to the candlestick where each is located. Step three: determine whether price has indeed made a new high and whether RSI has indeed declined; if the difference between the two is extremely small, do not write measurement noise as clear divergence. Step four: wait for price itself to provide evidence of change, such as falling back inside the previous upward structure, a key retracement low being broken, or a rebound failing to recover the original high. Different people may use different confirmation conditions, but they must be written clearly in advance.
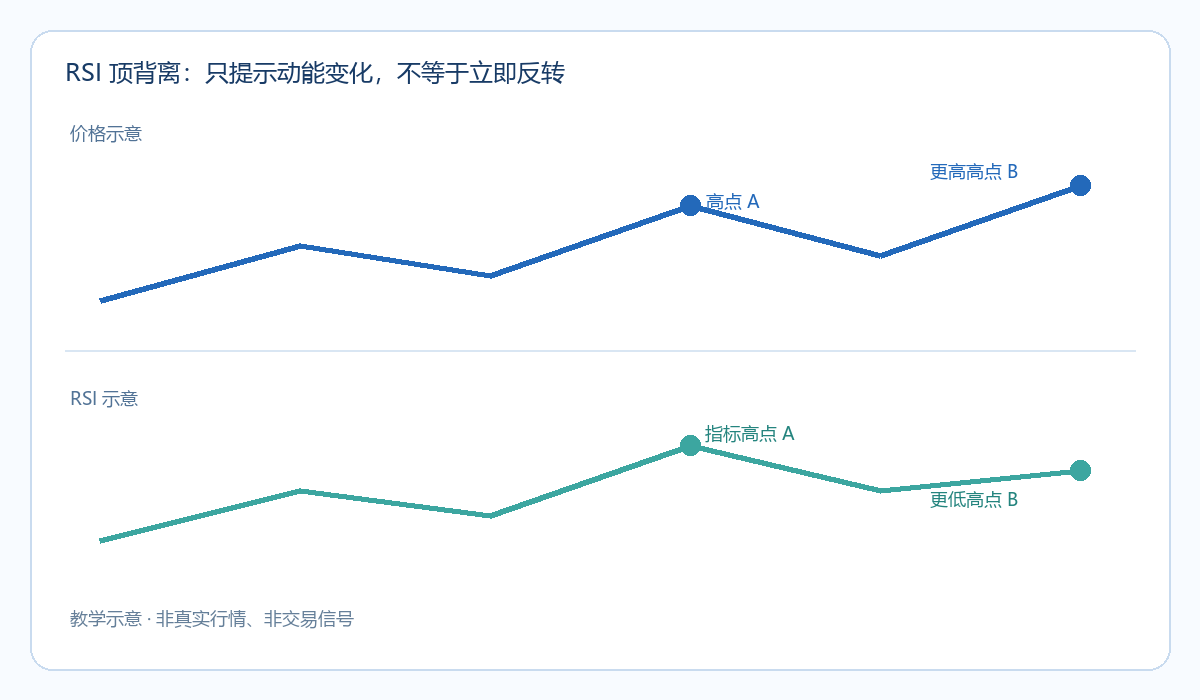
In the chart, the second high of the blue line is higher than the first, while the second peak of the green RSI line is lower, forming the educational shape of bearish divergence. The chart contains no real quotes, dates, or platform data; it demonstrates the comparison method and does not mean that gold has already formed a selling opportunity.
Why Price May Keep Rising After Divergence Appears
RSI calculates relative strength of advances and declines, not a guarantee of future price direction. Price can slow its pace of rise while continuing to refresh highs; in a ranging market, the two peaks may simply be range fluctuations; in a strong trend, the indicator may also remain in an elevated area for a long time. If the second price high has not yet completed and the RSI peak is still changing, judging too early can easily lead to repeatedly revising conclusions. News shocks, widening spreads, and liquidity changes may also cause actual price action to deviate from chart expectations.
Therefore, divergence is better used as a reminder to "re-examine the original upward assumption" rather than as an independent order instruction. Those already holding positions can review the exit conditions in their original plan; those not holding positions can wait for price structure and risk boundaries to become clearer. If price continues to raise highs and lows, and subsequent RSI makes a new peak again, the original bearish divergence judgment should be withdrawn or downgraded; one must not keep redrawing lines to defend an old view.
Common Mistakes and Risk Boundaries
There are three common mistakes: directly calling RSI above 70 divergence; comparing price and RSI on different timeframes; and ignoring the structure in between upon seeing two different points. 70 is a common overbought reference threshold, not the definition of divergence. Another mistake is showing only successful reversal samples after the fact and deleting charts of failed divergence; this seriously overestimates the reliability of the method.
When reviewing, it is best to record the two turning points, RSI parameters, time of occurrence, confirmation conditions, and invalidation conditions together, and retain cases where no reversal occurred. No stop-loss can guarantee execution at the preset price, and leverage amplifies losses. RSI divergence can help describe differences in momentum, but it cannot predict a turning point on its own, let alone guarantee trading profits.

MT4 EA troubleshooting guides →