Should You Sell Gold When RSI Is Above 70? The Correct Way to Read Overbought Signals
RSI's 70 and 30 are momentum reference lines, not automatic buy or sell instructions. Original educational charts illustrate persistent overbought conditions in strong trends, divergence, and invalidation judgments.
Author: Thomas | Technical Analysis Tutorial | October 25, 2026
"Gold RSI is above 70—should I sell right away?" This is a very common search question. The answer is: you cannot decide based on this one item alone. The Relative Strength Index (RSI) compares the average upward change and average downward change over a period, with the result falling between 0 and 100. Traditionally, above 70 is called "overbought" and below 30 "oversold," describing whether recent momentum is relatively strong or weak; it does not mean the price is already too expensive or too cheap, nor does it guarantee the next candlestick will reverse. This article only discusses chart-reading methods; the illustrations below are original educational schematics, not real gold market data.
What RSI Actually Measures
The RSI proposed by Welles Wilder is calculated from average upward changes and average downward changes, with a common period of 14. If several consecutive segments are dominated by upward moves, the indicator rises; conversely, it falls when downward moves dominate. The 14 candlesticks of different chart timeframes represent different time spans: H1 is 14 hourly candlesticks, D1 is 14 daily candlesticks. It also does not equal a "70% probability of rising." After adding the indicator in MT4, first record the symbol, broker, chart timeframe, RSI parameters, and whether the candlesticks used are completed; do not directly compare values from different conventions.
Why It Can Keep Rising Above 70
In a strong trend, price can make consecutive new highs, with average gains persistently outweighing average losses, so RSI may remain near or above 70 for an extended time. Fidelity's indicator documentation also explicitly warns that overbought or oversold conditions may persist for a long time in strong trends. The light blue area in the chart simulates consecutive upward movement; RSI first crosses above 70, and price subsequently still makes new highs. If you assume a top at the first touch of 70, you misread "strong momentum" as "reversal has occurred." Similarly, below 30 cannot be directly treated as a bottom.
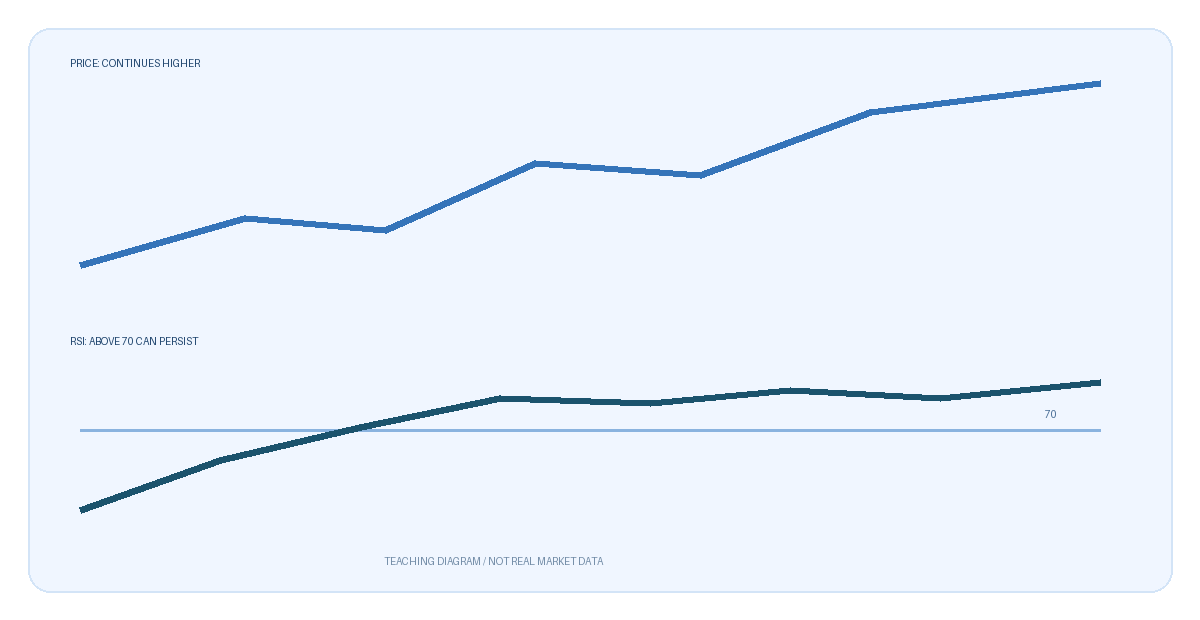
The chart contains no dates, real quotes, or backtested trades. The horizontal 70 line merely represents a common reference threshold; the price continuation on the right is to show that the indicator and price may be out of sync, not to predict future movement.
How to Check Step by Step
First, judge the background using completed price candlesticks: are recent highs and lows successively rising, and is price inside or at the edge of a range? Second, fix one decision timeframe and read RSI on the same timeframe; do not switch charts temporarily just because the signal is unsatisfactory. Third, mark the price high at the first crossing above 70, then observe whether price continues to make new highs, moves sideways, or returns to the original range; this step is primarily about price behavior, with the indicator secondary.
Fourth, if price makes a higher high while RSI does not make a corresponding new high, you can record a "bearish divergence candidate." It only indicates that the relative momentum of this upward move is not as strong as the previous one; it does not mean sell conditions are met. Also check whether price breaks below a pre-marked short-term swing low, whether a false breakout occurs, and take spreads and event volatility into account. Without repeatable price confirmation, do not write divergence as a confirmed reversal.
When to Overturn the Original Judgment
If you take "high-level momentum weakening" as an observation hypothesis, and price continues to hold above the prior high, forms higher lows, and RSI strengthens again, this bearish hypothesis needs to be withdrawn. If you take "above 70 represents upward strength" as a hypothesis, but price falls back into the original breakout range and subsequent retests cannot recover, the strong interpretation needs to be re-examined. Both conditions should be written down before seeing the outcome, to avoid redrawing thresholds and highs/lows after the chart has played out.
There are three other common mistakes: treating the temporary RSI reading of an incomplete candlestick as a final signal; stitching together prices and indicators across platforms; and constantly changing parameters such as 14, 70, and 30 to make historical cases look good. Parameters can be tested, but samples, costs, failure cases, and out-of-sample performance should be recorded. RSI is only a reprocessing of price changes; it cannot independently address slippage, leverage, and sudden news risk, and it provides no guarantee of returns.

MT4 EA troubleshooting guides →