What to Do When the Larger Timeframe Is Up and the Smaller Timeframe Is Down? Two Charts to See Multi-Timeframe Divergence
Using a complete view and an enlarged view of the final segment from the same set of teaching data, distinguish background structure from the current pullback, and fix timeframe responsibilities and invalidation conditions.
Author: Thomas | Technical Analysis | October 14, 2026
The same gold price movement may be a pullback in a longer observation window, yet show continuous downward movement in a shorter window. This does not necessarily mean the charts contradict each other; it may be that the two charts answer different questions. The focus of multi-timeframe analysis is to fix each timeframe's responsibility and invalidation conditions, rather than repeatedly switching until finding a chart that supports one's view.
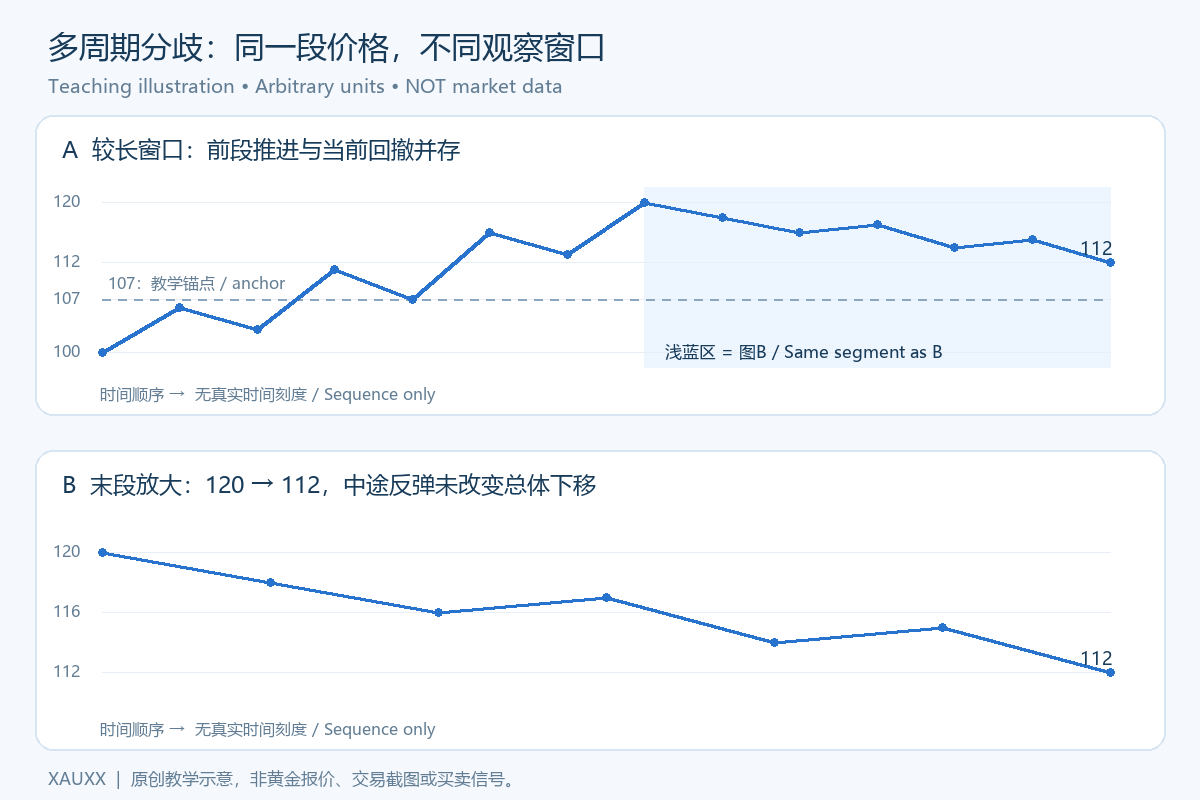
This article includes original light blue teaching charts. All numbers are arbitrary teaching units, not actual XAUUSD quotes, and there are no real trading dates or time scales. Chart B enlarges the final segment of Chart A; both views come from the same set of hypothetical data.
First Distinguish Observation Window from Candlestick Timeframe
The observation window is how much history is displayed on the chart, while the candlestick timeframe is how much price activity each candlestick summarizes. Expanding the display range does not equal changing the length of each candlestick; switching to shorter candlesticks does not equal obtaining a new independent market.
This article uses line charts to show window differences and does not simulate real candlestick aggregation. When applying to markets, record the instrument, quote side, data source, window, and candlestick timeframe to avoid mistaking setting changes for changes in price evidence.
Chart A: Longer Window Retains Earlier Structure
Chart A starts from teaching unit 100, advances to 120 in the earlier segment, and returns to 112 in the latest segment. The earlier observation anchor 107 is marked with a dashed line, and the end is temporarily still above it. It shows that prior advance and current decline can coexist.
107 is only a pre-specified structural reference in this teaching sample, not today's support, and certainly does not guarantee a price rebound. If the research method uses this anchor as a condition, it must specify what state counts as a break, rather than moving it after seeing a decline.
Chart B: Enlarged Final Segment, Short-Term Is Indeed Down
Chart B shows the same path from 120 to 112, with small rebounds along the way, but the overall downward movement cannot be ignored because of them. It answers how the final segment evolves, while Chart A explains where this movement sits within longer history.
The two charts are not two votes for bullish or bearish. They share the same price sample and cannot be treated as two independent verifications. A longer window retaining structure also cannot offset the pressure occurring in a shorter window.
Give Each Chart a Fixed Responsibility
One teaching division of labor is: the background view records prior structure, the process view checks the current pullback, and the execution view verifies pre-set trigger conditions. This division is an observation framework, not a live-tested profitable system.
How many charts to use and what timeframe ratios to use should match the observation objective. Do not assume a combination is necessarily suitable for all gold platforms, trading costs, and holding periods just because it is often discussed.
When Divergence Appears, First Mark It as To Be Confirmed
If the background has not yet broken while the process continues to move down, one can record "background retained, short-term not recovered" rather than forcibly classifying it as a confirmed uptrend. Waiting itself does not guarantee a better outcome, but it can avoid packaging insufficient evidence as high certainty.
Invalidation conditions should also be layered: a change in the process hypothesis does not automatically overturn the entire background; when the background condition is broken, one cannot continue to declare the original judgment valid based on a single short-term rebound. Record the corresponding layer, then update the conclusion.
When Switching Timeframes, Preserve the Original Standards
Before analysis, write down the main observation timeframe, the basis for the background anchor, trigger requirements, and invalidation states. When modifying settings, note the reason and time, and keep the original record. Temporarily extending the timeframe after price moves adversely can easily turn an original short-term judgment into indefinite waiting.
In review, also save samples with consistent windows, divergent windows, and those that cannot be judged, not only showing charts that went smoothly in hindsight. Without complete statistics and trading costs, one cannot claim that a multi-timeframe combination improves a fixed win rate.
Multi-timeframe charts can organize information but cannot guarantee future movement. Real execution still requires checking execution conditions and risk amount. This article is for technical education and does not constitute buy or sell instructions; leveraged trading may cause significant losses.
MT4 EA troubleshooting guides →