Repeated Golden Cross and Death Cross on Gold Moving Averages: Why Do They Easily Fail in Ranging Markets?
Moving average crossovers behave differently in trends and in sideways markets. Original light-colored dual-scenario charts illustrate the causes of repeated false signals, review methods, and failure conditions.
Author: Thomas | Technical Analysis Experience | October 30, 2026
Some traders add two moving averages to a gold chart: buy when the short-term moving average crosses above the long-term moving average, and sell when it crosses below. When the trend is smooth, this rule looks clear; once the market moves sideways, the same area may see repeated golden crosses and death crosses within a few days, and after a stop-loss, a reverse signal may appear. The problem may not be that the parameters were chosen incorrectly; more likely, the trend environment on which the method depends has disappeared.
Why Moving Averages Cross Back and Forth in Sideways Markets
A moving average compresses the prices of a past number of candlesticks into a smooth curve. Short-period moving averages react faster to new prices, while long-period ones react more slowly. When price fluctuates up and down around a narrow range, the short moving average is easily pulled above the long moving average first, then falls back below it with the next pullback. Each crossover reflects the relative position of the average price over the past period and does not guarantee that the next move will continue. Fidelity's moving average educational materials also emphasize that moving averages usually lag price, and the more sensitive they are, the more prone they are to back-and-forth whipsawing.
A so-called golden cross only indicates that the fast line has crossed above the slow line from below; it does not indicate that price has broken above the upper edge of the range. If neither the top nor the bottom of the range has been effectively broken, entering only in the direction of the crossover may mean taking on opposite fluctuations each time price approaches the edge of the range. Interpreting an increase in the number of crossovers as "more opportunities" also ignores the accumulation of spreads, commissions, and slippage.
Two Illustrative Charts: The Difference Between Ranging and Trending
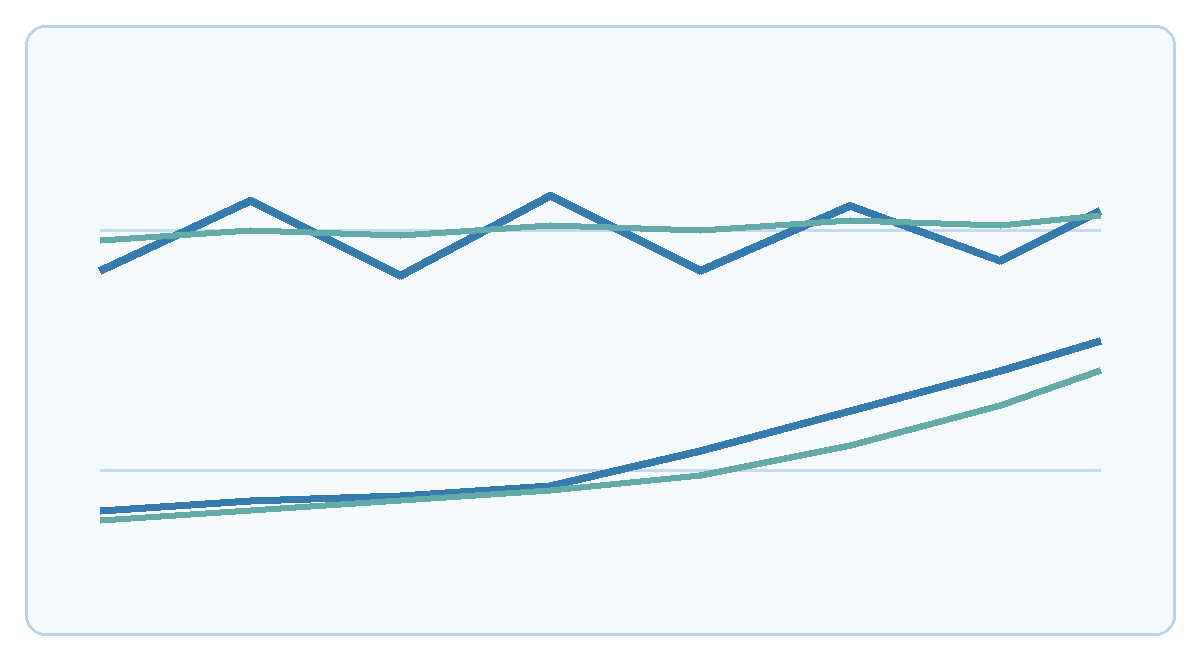
The upper half of the chart uses a blue line to represent a price path that repeatedly moves up and down, and a green line to represent a relatively flat moving average; price crosses the moving average multiple times but does not leave the horizontal range. In the lower half, price gradually rises, the moving average also begins to slope upward, and the two maintain a same-direction structure for longer. This is an original simplified illustration to aid understanding, not real gold market data; the two curves in the chart are also not used to calculate actual moving average indicator values.
When reviewing live trades, look at your own platform's chart: first mark the recent high and low boundaries on the same timeframe, then see whether the crossover occurs in the middle of the range, at the edge, or after already leaving the range. If the slope of the moving average is nearly horizontal and price repeatedly returns to the original area, the crossover is more likely just a byproduct of ranging. Only if price forms consecutive higher lows or lower highs outside the range may the direction of the moving average provide trend confirmation.
How to Handle Consecutive False Signals
First, fix the instrument, timeframe, and the types and parameters of the two moving averages; do not optimize only on historical charts to perfection after every loss. Second, record at least two types of samples: crossovers after price successfully leaves the range, and crossovers when price does not leave the range. Comparing the trading costs and failure counts of the latter is the only way to know whether the rule suits a sideways environment. Third, set environment failure conditions for the method, such as price repeatedly returning to the range, moving averages flattening again, and the distance between the two lines continuously narrowing; when these occur, stop treating crossovers as independent trend confirmation.
Some people add a third moving average or lengthen the parameters to reduce the number of signals, but this increases reaction delay and cannot eliminate all false signals. Others wait for a pullback after a breakout before judging, but a pullback may not occur, and the breakout may also fail. Method selection should be recorded together with the risk budget and trading costs, rather than showing only successful cases.
Risk Boundaries
Gold quotes and trading costs are not completely identical across platforms, and spreads and slippage may also widen during news periods. Moving average crossovers describe historical prices and do not predict the future. This article is a review of a technical method, contains no intraday entry levels, and does not constitute trading advice; leverage may amplify losses.

MT4 EA troubleshooting guides →