Why Does Gold Still Fall After a Moving Average Golden Cross? Identifying False Signals in Ranging Markets
Starting from moving average algorithms, candlestick closes, and price structure, use the white-and-blue educational chart to distinguish trend continuation from repeated crosses during ranging.
Author: Thomas | Technical Analysis Tutorial | October 23, 2026
"Why does gold still fall after a moving average golden cross?" Because a cross reflects price changes that have already happened, not a promise the market makes about the next move. The two moving averages each summarize historical prices over different lengths; when the short-term line crosses from below to above the long-term line, it only shows that the average price over the recent stretch is relatively stronger. Especially in a ranging zone, price repeatedly crosses the moving averages, and golden crosses and death crosses take turns appearing. Below, the definition, chart-checking order, and invalidation conditions are placed on the same schematic diagram, without using today's real gold quotes.
First, unify the calculation basis of the "moving average"
A moving average is the average value calculated from prices over a selected number of periods. The simple moving average (SMA) gives equal weight to every observation in the window; the exponential moving average (EMA) gives higher weight to recent values, so the two respond at different speeds to the same stretch of price action. The official MetaTrader 4 help also lists types such as smoothed and linear weighted. If someone says "20-day moving average" without specifying whether it is a daily chart or 20 hourly candles, whether it uses closing price or another price field, and whether it is SMA or EMA, their cross cannot be verified.
For teaching purposes, first fix two periods, for example a short line of 10 candles and a long line of 30 candles, then fix the same quote platform and the same chart timeframe. The 10 and 30 here are only for demonstration, not the best parameters for gold. The shorter the window, the closer the moving average hugs price and the more easily it is driven by short-term noise; the longer the window, the smoother the changes and the more likely it is to slowly change direction only after a turn. Constantly changing parameters afterward to pick good-looking crosses can make a historical chart look accurate, but it is not reproducible.
What actually happens on the chart at a golden cross
The short-period moving average was originally below the long-period moving average and then crosses upward through it, forming what is usually called a golden cross. The cross point must be confirmed after the candlestick of the selected timeframe is complete: if you are looking at a one-hour chart, an intraday cross before that hour closes may disappear before the close. At this point, first look at whether price itself has shifted from successively lower highs and lows to rising ones, or is still moving back and forth within the same ranging box. An indicator event cannot replace price structure.
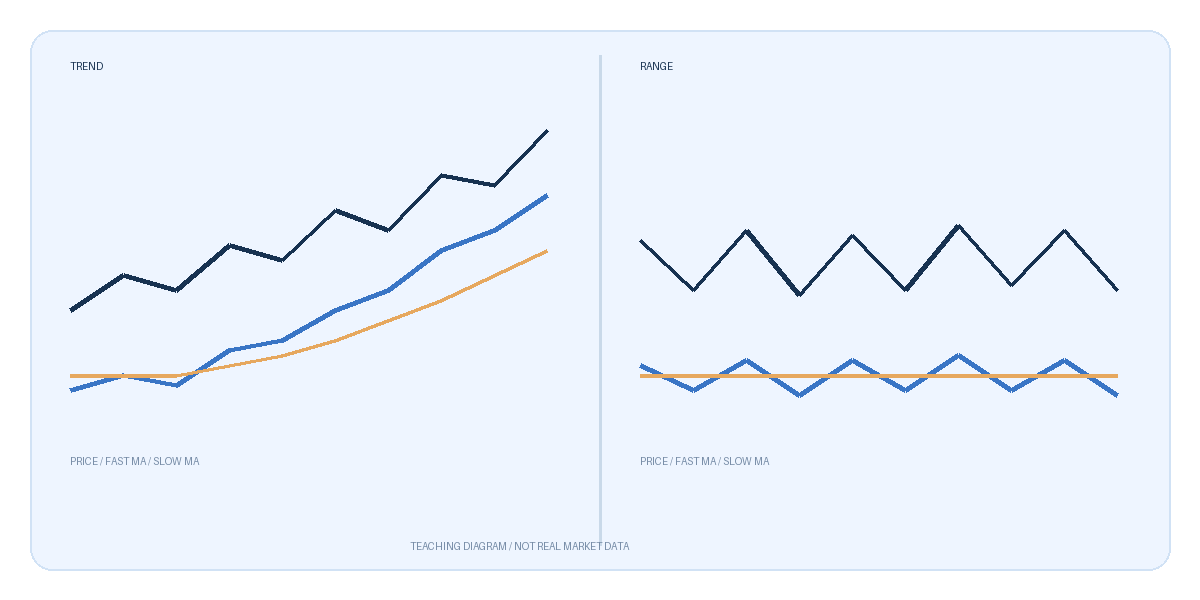
The left side of the figure uses an educational line to show price gradually forming higher lows, with the short line crossing above the long line and the two lines keeping a certain distance; the right side shows price swinging repeatedly around the middle of a range, with the short line continually crossing the long line. The figure contains no real dates, quotes, or trading records, and does not mean the cross on the left is necessarily profitable. What really needs to be distinguished is the two environments, not just counting crosses.
A step-by-step verification method
Step one: in advance, write down the instrument, platform, server time, chart timeframe, price field, and the type and parameters of the two moving averages. Step two: wait for the candlestick to complete, and record where price is relative to the most recent swing high and low when the cross occurs. Step three: check whether price has already left the original sideways range, or only gives a cross in the middle of the range; if it is still in the middle of the range, acknowledge that the probability of a false signal is high. Step four: observe the next pullback: whether the short line continues to stay above the long line, and whether price keeps making higher lows. Step five: before making a judgment, write down invalidation conditions rather than moving the moving averages afterward to protect the original view.
For example, after observing an upward cross, if price quickly falls back into the original range and the short line then crosses back below the long line, the original trend-continuation explanation should be withdrawn. Conversely, if price briefly pulls back to the moving average but the structural low is not broken, that alone is not enough to conclude that the direction has reversed based on a single touch. Both outcomes must be tested by completed candlesticks on the same timeframe.
Three common misuses and risk boundaries
The first misuse is writing every golden cross in a narrow sideways market as a new trend. The second is chasing a lagging cross after an uptrend has already gone far, while ignoring the distance between entry and invalidation price. The third is directly applying a cross signal from one platform to another platform's XAUUSD chart; differences in quotes, weekend data, spreads, and server time can also change the cross location.
Moving averages are calculated from historical prices and cannot know new data or news in advance. Crosses can help organize trends, but cannot guarantee the next stretch of volatility; abnormal spreads, slippage, and leverage can also make chart judgments differ greatly from actual execution results. This article only provides a reproducible chart-reading process and does not provide definite trade calls or profit guarantees.

MT4 EA troubleshooting guides →