Does a Shrinking MACD Histogram Mean a Gold Reversal? Check the Zero Line and Price Structure First
A shrinking MACD histogram only means the distance between the two lines is narrowing; it does not mean gold has already reversed. Use the illustrative diagram to break down the verification steps and invalidation conditions. This is a reissued technical tutorial from November 2.
Author: Thomas | Technical Analysis Tutorial | Originally scheduled for November 2, 2026, 15:00; actually reissued on November 5.
Summary: When looking at gold charts, the MACD histogram going from long to short is often described as "momentum exhaustion." This statement has some descriptive value, but it is not proof that price is about to reverse. The histogram represents the difference between the MACD line and the signal line; shrinking means the distance between them is narrowing. A trend may be slowing, or it may simply pause briefly and then continue. This article only answers how to judge the meaning of a shrinking histogram. The example chart is an original teaching illustration, not real market data, and contains no trading levels.
First, clarify what the histogram is measuring
Common MACD settings use the difference between the 12-period and 26-period exponential moving averages as the MACD line, then take its 9-period exponential moving average as the signal line. The histogram is the distance between the two lines, not a bar record of gold price rises and falls. When the histogram above the zero line goes from high to low, it indicates the positive difference is narrowing; this may come from the MACD line falling or from the signal line rising, and color alone cannot give a directional conclusion. Different parameters, chart timeframes, or platform algorithm settings will also produce different patterns.
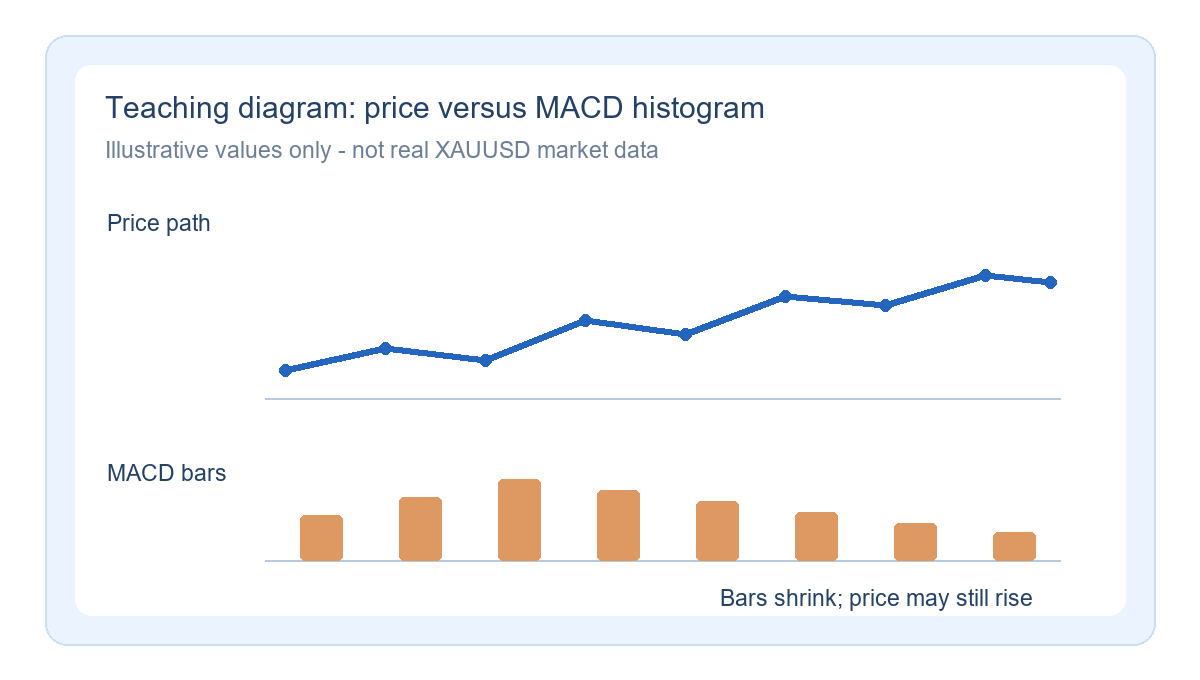
In the upper part of the image, the hypothetical price path is still rising in the later section; in the lower part, the positive MACD histogram gradually becomes shorter. These occurring at the same time is not contradictory: price may still make new highs, but the pace of the rise may slow. The illustration does not use real gold market data, times, or quotes. If the first shrinking bar is directly treated as a sell signal, then "a change in speed" is mistakenly written as "a change in direction."
Check the signal in four steps
Step one: fix the same platform, the same XAUUSD instrument, and the same chart timeframe; do not mix hourly-chart histogram readings with daily price structure. Step two: record which side of the zero line the histogram is on, and whether it is narrowing continuously or only fluctuating for one bar. Step three: see whether price still maintains rising highs and lows; only when the structure is broken does the weakening judgment gain another layer of evidence. Step four: observe whether the MACD line crosses the signal line, and whether it can hold after the cross. Even if a cross occurs, it may repeatedly cross back and forth in a sideways range, so confirmation after a price breakout or breakdown is still needed.
For example, suppose that in a certain teaching chart, price continuously forms higher lows, and the positive MACD histogram shrinks from five blocks to two. A reasonable statement would be "the upward momentum indicator has pulled back; wait for price structure confirmation," not "gold has topped." If price later breaks below the previous identifiable pullback low and a rebound fails to recover it, the reversal hypothesis has more basis; if price breaks back above and holds, the earlier weakening guess is invalidated. The example only explains the order of judgment and does not correspond to any market quote.
Common misreadings and invalidation environments
Divergence also requires caution: price making a new high while the histogram peak declines only means the momentum indicator has not made a new high in sync; it cannot automatically be inferred that the next candlestick will fall. In strong trends, divergence can persist for a long time; in ranging markets, MACD crosses easily appear back and forth. Wider spreads, price jumps, and slippage around news releases may cause the signal on the chart to differ noticeably from actual execution. Treat MACD as an observation tool: first write down the invalidation conditions of the price structure and the risk you can bear, then consider whether to take action. No indicator can guarantee returns.

MT4 EA troubleshooting guides →