Should You Buy Gold on a MACD Golden Cross? Four Steps to Judge Whether the Cross Is Reliable
A MACD golden cross is only the main line crossing the signal line. With an original light-blue illustration, this explains the zero-line position, price structure, range false signals and invalidation conditions.
Author: Thomas | Technical Analysis Tutorial | October 22, 2026
"The MACD has made a golden cross, so must you buy gold?" This mistakes an indicator event for a complete trading conclusion. MACD reflects the difference between two exponential moving averages and how it changes; a golden cross only means the MACD line has crossed above the signal line. It does not mean price has broken resistance, still less guarantee that the next candlestick will keep rising. This article uses an original illustration to break down the order of judgment; it does not discuss today's gold quotes or price levels.
First, be clear which two lines the golden cross involves
Common MACD parameters are written as 12, 26, 9: first subtract the 26-period exponential moving average of closing prices from the 12-period exponential moving average to get the MACD main line; then smooth the main line with a 9-period average to get the signal line. If the main line crosses above the signal line, it is called a golden cross; crossing below is called a death cross. The signal line in the official MetaTrader 4 help is a 9-period simple moving average, while other charting tools may use exponential smoothing, so readings and cross times for the same stretch of price action may not be exactly the same. Before comparing two charts, first check the software, instrument, timeframe, price source and calculation method.
There is another common confusion: the MACD main line crossing above the signal line and the main line crossing above the zero line are two different things. A golden cross above the zero line may occur after a pullback within an existing uptrend; a golden cross below the zero line may also be only a brief rebound within a decline. Neither position is an independent guarantee to buy. If the histogram shows the difference between the main line and the signal line, its change from negative to positive is related to the golden cross, but the software's histogram definition and presentation should also be checked against the indicator documentation in use.
A reproducible four-step chart-reading method
Step one: fix the chart timeframe and parameters, and confirm the cross only with completed candlesticks. If the two lines briefly touch during the session and separate again after the close, it should not be written up as a confirmed golden cross. Step two: look at whether price itself is making higher highs and higher lows, moving sideways, or continuing to make new lows. Indicators are processed output from price; if the price structure has not changed, the interpretation of a golden cross should remain cautious. Step three: mark the range boundaries or swing highs determined in advance, then ask whether price has actually stood above the relevant area. Step four: write the invalidation conditions in advance: for example, on the chosen timeframe, price falls back into the range again, or the MACD main line crosses back below the signal line. If the invalidation conditions are met, cancel the earlier bullish observation rather than picking parameters again after the fact.
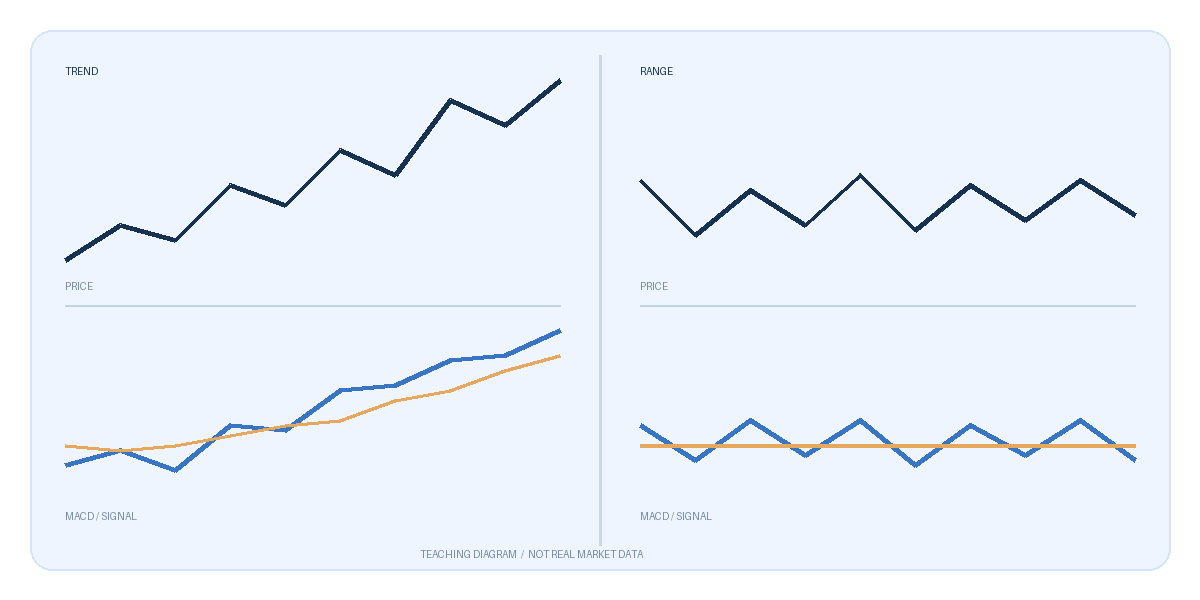
The left side of the figure is a teaching-style upward structure: price highs and lows are rising, and the golden cross is only one auxiliary observation; the right side is a sideways structure: the main line repeatedly crosses near the signal line while price remains inside the range. Neither figure contains real quotes, dates or backtest win rates, nor does it imply that the left side must be profitable. The key difference lies in the price structure and the environment in which the cross occurs, not in the two words "golden cross."
Which situations are most easily misread
Rapid repeated crosses in a trading range may produce opposite signals one after another; Fidelity's indicator explanation also warns that MACD tends to swing back and forth within trading ranges. In a strong one-way decline, a slowdown in the fall may produce a golden cross below the zero line, but that does not mean the trend has reversed. After a high-volatility event, the smoothing of moving averages over old data brings lag; chasing price only after seeing the cross may also run into wider spreads, slippage or the next pullback.
Divergence also requires the same caution. If the highs and lows of price and MACD do not change in the same way, first fix the two price turning points being compared and the same timeframe, then observe whether price subsequently confirms. You must not move the turning points after the outcome appears and draw every look back as an "early warning."
Restore the indicator to an observation tool
When recording a golden cross, keep at least the platform, instrument, timeframe, 12/26/9 parameters, signal-line algorithm, candlestick close time, the price structure and the conditions for canceling the judgment. Quotes and trading sessions for XAUUSD may also differ across platforms, and an indicator cross on one platform cannot be used to promise execution results on another. MACD is suitable as an aid for organizing trend and momentum; it cannot replace position sizing, trading costs and risk control. Leveraged trading can cause major losses, and no indicator cross guarantees profit.

MT4 EA troubleshooting guides →