Does a Gold Rebound That Fails to Make a New High Count as a Turn to the Downside? First Check the Lows and the Recovery Process
A stalled rebound is only a structural clue. Using non-real market illustrations, distinguish between a slowing uptrend, range consolidation, and downside confirmation, and avoid picking turning points after the fact.
Author: Thomas | Technical Analysis | November 11, 2026
Summary: A lower rebound high after an advance is not enough on its own to confirm a downtrend. The harder part in practice is that when highs stop advancing, the prior lows are still holding. At this point, "slowing upside" and "downside established" need to be separated, and the unresolved structure recorded, rather than immediately switching to a different directional label.
What evidence is missing when a rebound fails to make a new high
Common trend analysis treats successively higher highs and lows as a feature of an uptrend, and successively lower highs and lows as a feature of a downtrend. This is an observational framework; the criteria for selecting turning points, the timeframe used, and the confirmation method all affect the conclusion.
When a rebound does not exceed the prior high but the pullback remains above the prior low, the clues on the two sides are inconsistent: high advancement is temporarily blocked, but low support has not yet been broken. A more prudent description is that the structure has entered a pending-confirmation phase. Writing it directly as already turned bearish omits the path in which price may later consolidate or rise again.
Why the chart cannot immediately confirm a turn to the downside
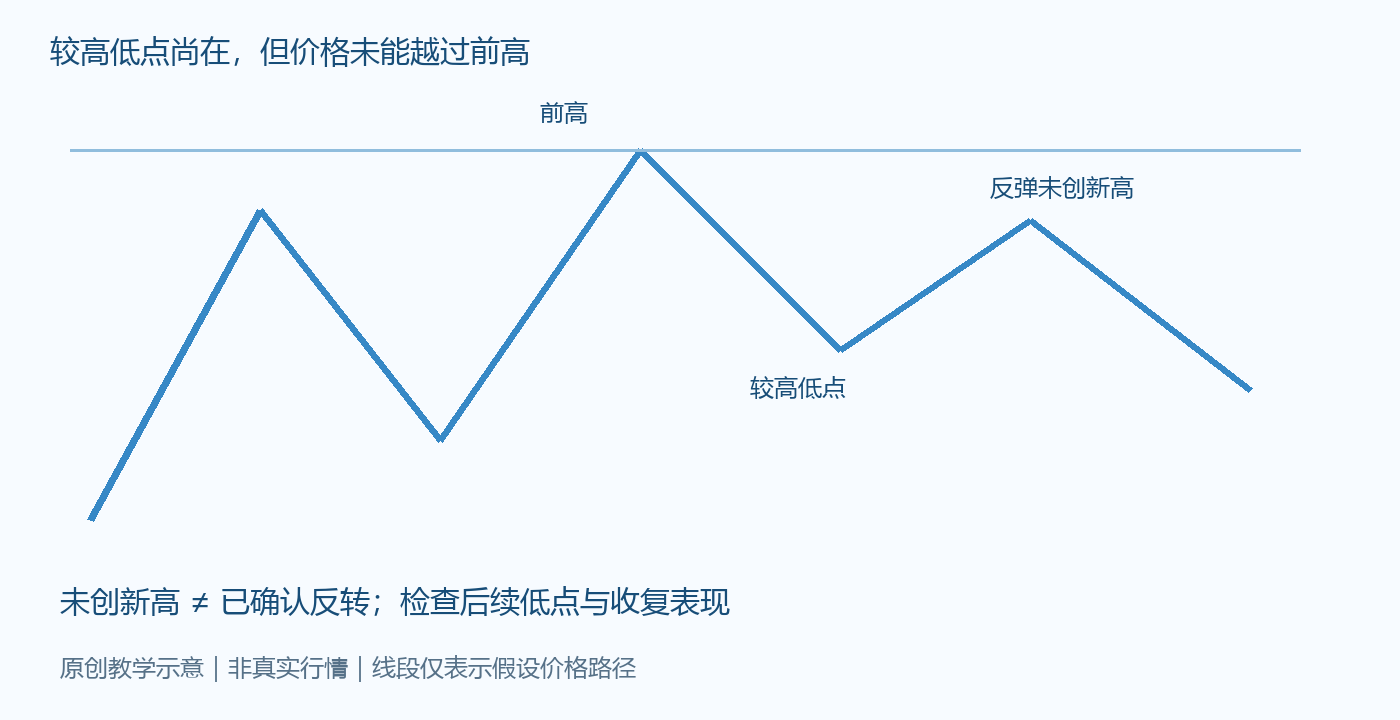
The illustration is an original hypothetical path, not real gold market data, and has no actual price coordinates. Price first raises highs and lows, then a rebound fails to exceed the prior high. The meaning of the final pullback in the chart depends on whether the previous confirmed pullback low holds, and whether price can recover after breaking below it.
If the low continues to hold and price later exceeds the prior high again, the earlier high-low points may have been only local fluctuations within consolidation. If the low is lost, the rebound cannot recover, and a new lower low then forms, the evidence for a downtrend structure gradually accumulates. Both paths require subsequent data; an unfinished illustrative line cannot prove that one of them will definitely occur.
Define the turning-point criteria first, then look at the market
Before observing, fix the execution timeframe and clarify how a local turning point is confirmed. For example, if using local highs and lows with two closed candles on each side as the recording criteria, one must accept the delay until the right-side candles appear. This is only a reviewable example, not the only standard. If switching to another set of criteria midway, record it separately rather than applying the new criteria back to the past to create a perfect judgment.
Write down the confirmed prior high, prior low, and confirmation time. A rebound currently forming can only be marked as a candidate high first, and unclosed candles may continue to expand the range. Compare structures on the same platform and the same quote side, to avoid mistaking platform spreads or server time-zone differences for the market having already broken through.
How should failed cases be reviewed
A typical teaching mistake is: seeing lower highs and lows and concluding a turn to the downside, after which price consolidates and then breaks above the prior high. The problem may not be missing some indicator, but prematurely treating "no longer rising" as "already in a decline." In review, check whether the prior low was actually broken at the time, whether recovery was observed, and whether the information available at the time was sufficient to support the original conclusion.
Conversely, if the prior low is briefly broken and then quickly recovered, one cannot retroactively write the later rise as a false breakdown that was already clear at the time. Record the initial breach, the close on the selected timeframe, and the holding situation after recovery, distinguishing ex-ante conditions from ex-post results. This article describes hypothetical cases, not personal live-trading experience.
Applicable environment and boundaries of invalidation
This framework is suitable for trend or consolidation transition phases where highs and lows can be clearly identified. If price alternates frequently and local turning points are dense, trend labels will flip rapidly, and retaining a range judgment may better fit the evidence. Sudden news or quote gaps also increase the cost of waiting for confirmation, but this cannot be used to assume that early judgment is more reliable.
A bearish-leaning hypothesis needs reassessment when the key low is recovered and the corresponding rebound high is exceeded; a bullish-leaning hypothesis should also be withdrawn when the low is broken and recovery fails. Specific exit arrangements should follow a pre-set risk budget and must not be continuously expanded as the structure turns unfavorable. Technical structure is a tool for managing uncertainty and cannot guarantee direction or execution results.

MT4 EA troubleshooting guides →