Does gold always fall after a long upper shadow? Using two charts to see follow-through confirmation
After the same long upper shadow, price may fall back into the range or break above again. The charts explain location, timeframe, follow-through structure, and the invalidation conditions for the original judgment.
Author: Thomas | Technical Analysis | October 29, 2026
When a long upper shadow appears on a gold chart, readers often say "there is heavy selling pressure above, so it is going to fall next." That judgment is only half complete. An upper shadow shows that price reached a higher level during that period but failed to hold that area at the close; it does not tell us whether the next candle will continue lower, nor does it show that this pullback is enough to change the trend on a larger timeframe. Translating a single candlestick directly into a sell instruction often means ignoring location, timeframe, and follow-through evidence.
First understand a candlestick, rather than labeling it
A candlestick consists of four prices: open, high, low, and close. The upper shadow is the distance from the top of the body to the high. A longer upper shadow means price pulled back from a high level during that time period; a body near the lower end means the close was closer to the low of that period. CME's candlestick education treats long shadows as evidence of clear back-and-forth between buyers and sellers within that timeframe. It reflects the price path that has already occurred, not a prediction of the next candle.
Also ask first: is this a five-minute chart or a four-hour chart? "Long" on different timeframes cannot be compared directly. The same shadow may be only a liquidity fluctuation in the five minutes after a news release; after a multi-day rally, if it touches a resistance zone drawn in advance, its significance may be more worth tracking. The observation zone should have its rationale written down before the shadow is seen; you cannot wait until after the result and then draw it onto the most convenient location.
Use two follow-through paths to test the original judgment
In the chart, A and B share the same rally and the same long-upper-shadow candle; the difference occurs afterward. In A, price continues lower and falls back below the previously defined observation zone, so the original assumption of "holding after an upside breakout" needs to be reviewed. In B, price breaks above the shadow high again in the next phase and holds above it, so the single upper shadow did not confirm a weakening trend. Both patterns are teaching illustrations only, with no real gold quotes or timestamps. The point is to separate "seeing the shadow" from "price providing further confirmation."
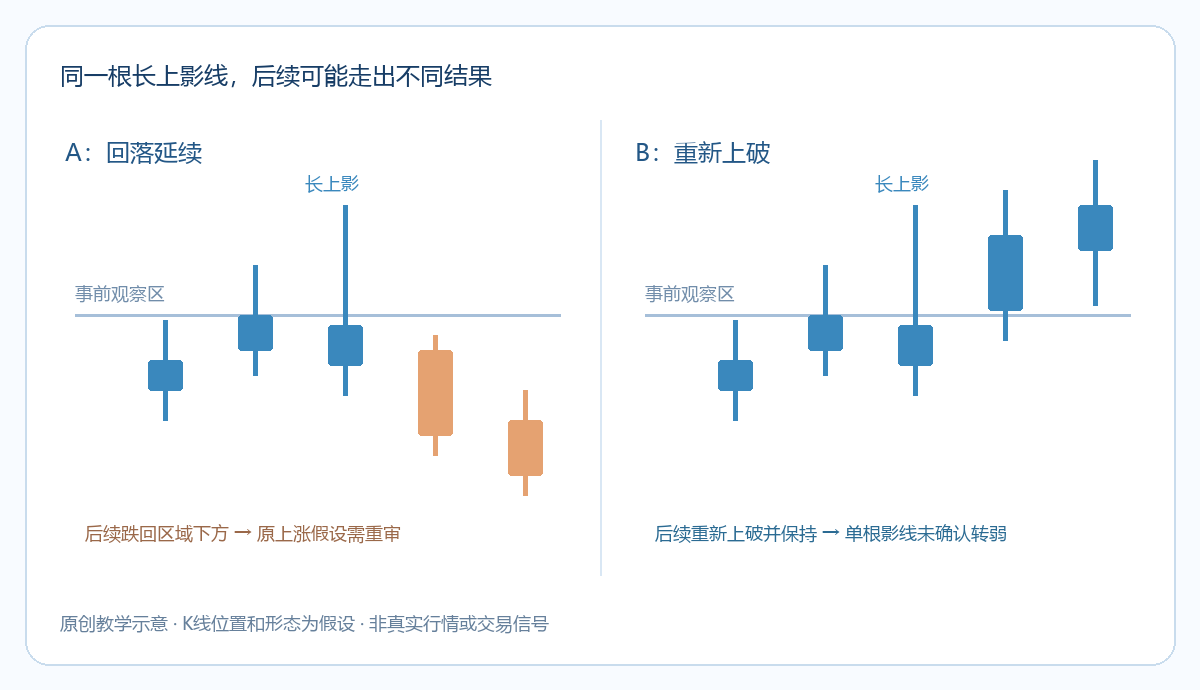
In actual review, four things can be recorded in order: first, the trend and resistance location before the shadow appeared; second, where the shadow closed relative to the observation zone; third, whether the next one to several candles break below the pullback low that had supported the rally; fourth, if price reclaims the shadow high, whether the original "weakening" assumption is invalidated. Confirmation rules must match the chart timeframe; you cannot arbitrarily extend the waiting time afterward until the desired answer appears.
Which scenarios are most prone to misjudgment
One misjudgment is calling any long upper shadow a "shooting star." Candlestick names usually also involve location, body proportion, and the prior move; the length of the upper shadow alone is not enough to confirm the complete pattern. Another is failing to compare spreads and quote sources: gold CFDs may have different quotes on different trading platforms, and highs and lows may differ slightly; another platform's shadow cannot be treated as an executable record for your own account.
A third is ignoring that the rally structure still exists. If lows keep rising and price makes a new high after a brief pullback, the long upper shadow only indicates that there was a pullback at the time; it cannot prove the structure has reversed. Conversely, if price breaks below a key low defined in advance and a rebound fails to recover the original range, the warning from the single shadow gains more price evidence. Even so, the trend may switch again, and this cannot be written as a certain outcome.
Leave clear invalidation conditions for the plan
The plan should not say "short whenever there is an upper shadow." It should clearly state the observation zone, the price change to wait for, which move would overturn the original judgment, and the loss the account can bear. Stop-losses and preset price levels are also not guaranteed to fill at the intended price during gaps or insufficient liquidity. A long upper shadow is suitable for raising questions; what really determines whether to adjust the view is where it appears and the subsequent price structure.

MT4 EA troubleshooting guides →