What to Do When Gold Repeatedly Crosses the Moving Average? First Identify a Sideways Environment Where the Moving Average Is Flat
Price crossing a moving average does not mean a trend is established. Use the original educational chart to check the moving average slope, the structure of highs and lows, and whether price holds after crossing, and understand the cost of filter conditions.
Author: Thomas | Technical Analysis Tutorial | November 6, 2026
Summary: You buy as soon as the gold price just rises above the moving average, then sell when it falls back below the moving average—why is it easy to suffer repeated losses? A moving average is a smoothed result of historical prices. Price crossing a moving average only shows that the relative position of the current price and this average line has changed; it cannot by itself prove that a trend has formed. This article only answers how to identify such repeated crossings in a sideways environment, provides fixed checking steps, and does not involve today's gold price levels.
What a Flat Moving Average Means
A simple moving average usually adds up the selected prices of the most recent several periods and then divides by the number of periods. When closing prices are used, a new candlestick enters the calculation and the earliest period exits, so the average updates accordingly. Longer parameters are usually smoother and also more lagging; shorter parameters react faster but retain more short-term noise. A moving average slope close to horizontal means that the average price change within that calculation window is small; it does not mean the market is about to break out in some direction immediately.
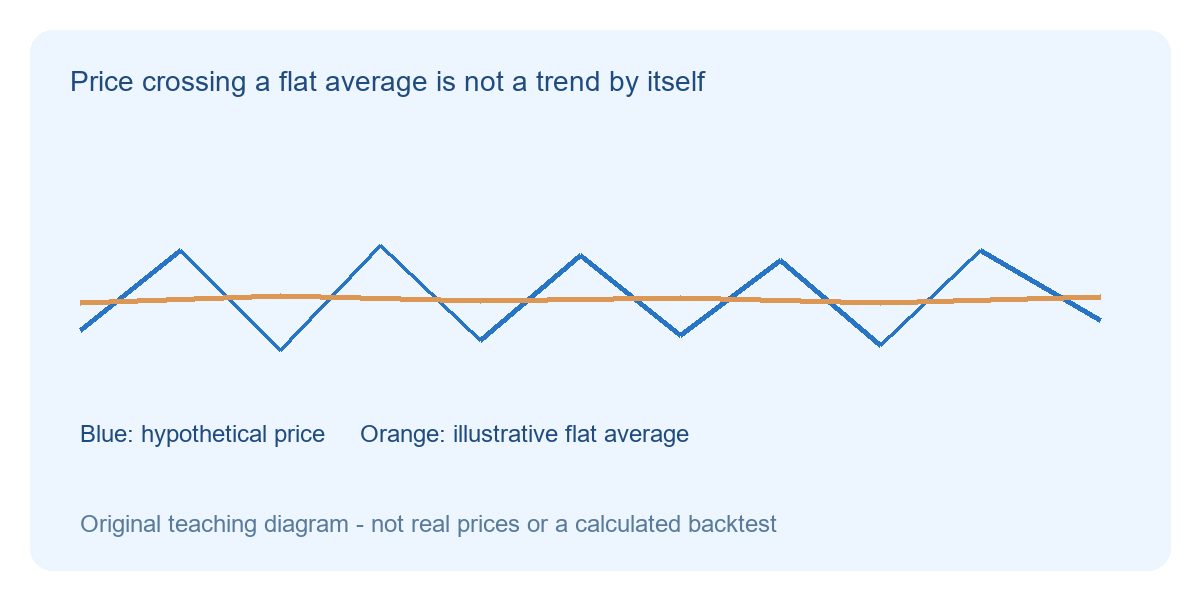
In the figure, the blue line is a hypothetical price moving back and forth around a zone, and the orange line represents a flat moving average. It is a conceptual illustration, not a real moving average calculated from these points, nor a gold backtest result. As can be seen, price reaches the other side from one side of the average line many times, but the highs and lows do not form a trend that continuously expands outward. A large number of crossings does not mean there are equally many exploitable trend opportunities.
Use Four Steps to Judge Whether It Is Only Range Fluctuation
Step one: fix the instrument, timeframe, moving average type, parameters, and price source to avoid quietly changing settings during comparison. Step two: check whether the moving average slope continues in the same direction, rather than looking only at the last small bend. Step three: mark the most recent identifiable highs and lows, and observe whether they are rising, moving lower, or still repeating within a similar range. Step four: check whether price can stay on the new side after crossing and expand the original range, rather than quickly returning to the middle.
If the moving average is flat, price is still in the original range, and price quickly returns after crossing, you can first downgrade the weight of the trend signal. This judgment does not require predicting whether the next crossing will succeed; rather, it acknowledges that the current evidence is insufficient. Range boundaries should also come from actually identifiable highs and lows, and you must not casually add a horizontal line without basis just to filter signals.
Example: Confirmation Rules Also Have Costs
Suppose that in an educational chart, price crosses the moving average several times in a row and then returns to the original range. You can specify in advance that only when price closes outside the range and then retests without losing it should you continue to evaluate the trend scenario. If price quickly falls back into the breakout area, the original judgment becomes invalid. What is emphasized here is a fixed verification sequence, not a suggestion that all timeframes should use the same waiting method.
Waiting for confirmation may reduce some repeated signals, but it may also make entry later, increase the stop-loss distance, or miss moves that do not retest. Filter conditions cannot be described as a cost-free improvement in accuracy. Whether they are effective should be recorded with samples under the same parameters and cost assumptions, rather than selecting only a few successful charts.
Common Mistakes and Failure Conditions
Changing the parameter from 20 to 21, then switching to another moving average until recent losses are just avoided, is common hindsight parameter tuning. Longer parameters will not automatically eliminate sideways risk; they only change the response mode. Moving average crossovers, price crossovers, and slope changes are still different observation conditions, and they need to be recorded separately during review; the names must not be mixed.
If the range boundaries are continuously broken and the highs and lows begin to clearly expand in the same direction, the previous sideways assumption should be reassessed. News gaps, widening spreads, or changes in chart data conventions may also cause moving average judgments to lose their original explanatory power. Moving averages help organize historical information and cannot guarantee future direction; any method needs to be paired with clear failure conditions and an affordable loss.

MT4 EA troubleshooting guides →