After two highs appear in gold, how do you identify a failed double-top breakdown?
Use two original paths to compare continuation and recovery after a double-top neckline breakdown, and record when the judgment is valid and when it should be withdrawn.
Author: Thomas | Technical analysis experience | November 9, 2026
Summary: On a gold chart, there is often a clear pullback low between two similar highs. Double-top analysis can use it as a candidate neckline and observe whether price can hold after breaking below it. This article focuses on a failure scenario that is easy to miss: price briefly falls below the neckline and then recovers, so the original downside judgment needs to be reassessed.
First record the two highs and the middle low
Under the same quote source, instrument, and timeframe, select two highs that appear one after the other, and record the clear pullback low between them. The two highs do not need to be exactly the same; the zone range can be set in advance based on the volatility of the selected timeframe and chart precision. If the middle pullback is very shallow, or the two peaks are only minor variations within the same large move, lower your confidence in the pattern first. When recording dates, write down when each high and low could be confirmed, to avoid using candles that had not yet appeared to make judgments for that time after the fact.
The area around the middle low is the neckline zone for later observation. When the two highs first appear, price may still extend upward or continue moving sideways. You can save a screenshot of the candidate pattern, then write down which timeframe's close to observe and what change would alter the original judgment. When a new structure appears later, you can update the version and keep the old chart.
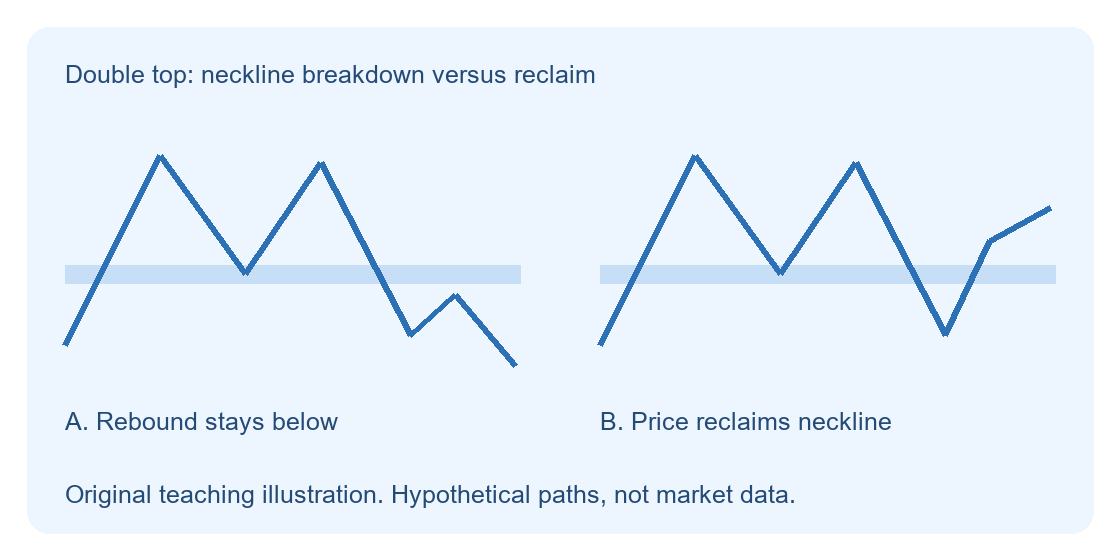
The left chart illustrates a rebound failing after a breakdown, and the right chart illustrates price reclaiming the neckline zone after a breakdown. The two paths use hypothetical shapes, and the focus is on the price reaction after the breakdown. The image does not use live gold market data and does not indicate the probability of either scenario occurring.
What follow-up evidence does a downside judgment need?
When price enters below the neckline for the first time, first check whether it is a brief intraday cross or a completed candle close outside the zone. If the selected timeframe has not yet ended, it can be temporarily recorded as a test. After confirming the breakdown, check whether the rebound remains below the neckline and whether price continues to form lower highs and lows. Even without a retest, you can continue recording the structure, but distinguish which observation conditions actually occurred.
Assume the two peaks are near 110 in the educational range, and the middle pullback low is 100. If price closes at 98, rebounds to 99, and then moves lower again, this set of hypothetical data supports a weaker observation. If price then returns to 102 and holds above the neckline on a retest, the original downside judgment needs to be withdrawn or given less weight. Specific tolerances and timeframes should be executed according to prior records; the numbers in the example do not correspond to any market level.
How to review after a failure appears
Record the time of the trigger, close, recovery, and subsequent retest. Count intraday pierces and closing breakdowns separately so that results using different confirmation rules can be compared. If price returns above the neckline and holds, or further breaks above the second high, the original double-top downside hypothesis lacks support. At that point there is also no need to automatically flip to an upside judgment; you can wait for a new high-low structure to form before assessing again.
This method is suitable for patterns where the peaks and middle low are relatively easy to identify. During periods of choppy movement, quote interruptions, or sudden spread widening, the comparability of boundaries decreases. Waiting for closes and retests may also make the judgment later; this cost should be recorded together with misjudgments. Actual positions also need to be estimated based on real bid/ask prices, possible slippage, and the loss the account can bear; the pattern itself cannot guarantee execution or returns.

MT4 EA troubleshooting guides →