Does a Doji in Gold Always Signal a Reversal? First Look at Open/Close Position and Subsequent Breakout
A doji only indicates that the open and close are close together; it cannot independently predict direction. Use the educational illustration to understand the definition, screening criteria, positional context, and conditions for confirmation failure.
Author: Thomas | Technical Analysis | November 13, 2026
Summary: A doji is often treated as a reversal signal, but a single candlestick can only describe the open, high, low, and close that have already occurred. An open and close that are close together may appear during a trend pause, range-bound oscillation, or periods of sparse quotes, and cannot automatically prove that bullish and bearish forces are about to reverse. This article only answers the question "Does a doji in gold mean a reversal?"
Definition: Look at the Body First, Not Just the Appearance
The core feature of a doji is that the open and close are the same or very close, so the body appears as a thin line or small horizontal bar. The length of the upper and lower shadows and the position of the body can form different variants; it cannot be required that all dojis be perfectly symmetrical. Educational materials from Fidelity and TradingView both emphasize the feature of an open and close that are the same or close; the identification criteria need not be limited to exact equality.
"Close" has no uniform value applicable to all instruments and timeframes. If writing screening rules, a ratio threshold for the body relative to the entire high-low range can be agreed upon in advance, but that threshold is only a research criterion and cannot be promoted as the only standard. The minimum price tick and chart display precision should also be checked to avoid treating display rounding as exact equality.
One Doji Does Not Mean There Was No Volatility
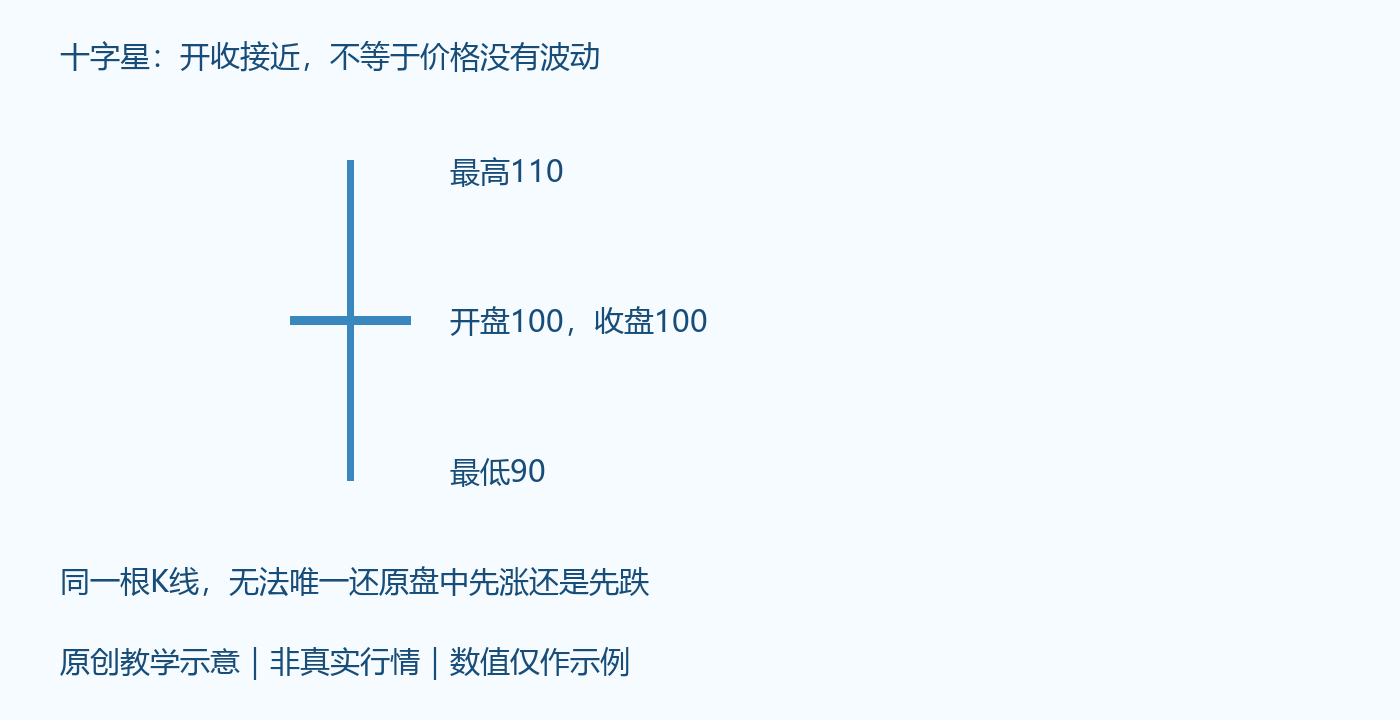
The chart assumes an open of 100, a high of 110, a low of 90, and a close of 100; all are educational data, not real gold market data. Although the open and close are the same, the high-low range during the period is 20 price units. Therefore, "no net change" and "no volatility" are different conclusions, and an equal open and close cannot be interpreted as no trading risk.
The same four prices can be formed by different intraday paths: touching the high first and then falling back, or probing lower first and then recovering, can both leave a similar candlestick. Looking only at the final pattern cannot uniquely confirm who acted first or who exited later, and it is even less valid to fabricate stories about a certain type of capital manipulating the market based on it.
How to Use This Clue Step by Step
Step one: wait for the selected timeframe to close, to avoid an unfinished candlestick changing its body in the final minutes. Step two: record the data source, server time zone, and candlestick timeframe; do not directly treat daily patterns from different platforms as completely identical. Step three: check the background before it appeared: was there a continuously advancing trend before, or a range that had already been moving sideways.
Step four: mark the high-low range of the doji and nearby structures that have already been confirmed. If the prior move was upward, and after the doji the price breaks below its low and cannot recover, that can serve as a clue for further observation of weakening; if price continues past the prior high and holds, the original weakening hypothesis needs to be withdrawn. A breakout of a single candlestick's range can still fail, and should be checked against the close of the selected timeframe and subsequent retests.
This sequence is not a fixed buy-sell formula. When a doji appears in the middle of a range, it may not have sufficiently clear positional significance; trying to find a trading direction for every pattern instead tends to increase arbitrary judgments.
How to Identify Common Misjudgments
The first mistake is to directly translate "indecision" into reversal. A trend may still continue after a pause. The second mistake is to ignore the preceding and following candlesticks and extract only one pattern that looks standard. The third mistake is to pick successful cases after the fact and then exclude failed patterns with the same appearance from the definition.
If the research adopts a certain body ratio threshold, all samples meeting the criteria should be retained at the same time, and the subsequent observation window should be recorded; the threshold cannot be changed after seeing the results. The appearance of reversals in a sample also cannot prove that all markets and timeframes have the same probability. This article does not provide unverified win rates or profit statistics.
Failure Environments and Risks
Stale quotes, abnormal spikes, low-activity periods, or missing data will weaken the explanatory value of the pattern. Different platforms' quote sides and trading sessions may also form different shadows; when inputs are inconsistent, the data should be checked first. Sudden events can make price jump directly past the pattern boundary, and waiting for confirmation cannot guarantee the exit price.
Risk budgeting should be independent of the candlestick name. Spreads, slippage, and position exposure need to be calculated separately; risk cannot be expanded just because a "standard doji" is seen. It is more suitable as a reminder to further check position and subsequent structure, rather than a direction button that replaces complete judgment.

MT4 EA troubleshooting guides →