Gold is falling on the daily chart and rising on the one-hour chart—what should you do when the two timeframes conflict?
First fix the primary timeframe, then use the larger timeframe to judge location and the hourly timeframe to define repair and invalidation; an original white-blue diagram explains the differences in the same price action at different scales.
Author: Thomas | Technical Analysis Tutorial | October 24, 2026
"The daily chart is still falling, but the one-hour chart is rising—which timeframe should gold be viewed on?" This is not a question of letting two charts vote on direction. Different timeframes aggregate different price ranges; a rebound on a short timeframe may be only a sub-segment of a decline on a long timeframe; conversely, what looks stable on a long timeframe may also conceal sharp fluctuations on a short timeframe. This article answers how to first determine your own decision timeframe, then use other timeframes to check the environment and invalidation conditions. The charts are original teaching illustrations, not the day's gold market.
First set the primary timeframe; do not switch charts after the result appears
MetaTrader 4 can display different timeframes such as M1, H1, H4, and D1, and each candlestick covers a different length of time. If the plan is to judge based on completed one-hour candlesticks, set the one-hour timeframe as the primary timeframe; use the daily chart to observe location over a larger range, and use smaller timeframes only to check execution details. You cannot, after a one-hour signal fails, change your story to "I was actually trading the daily chart," nor can you temporarily modify the original plan just because a shape you like appears on the five-minute chart.
Timeframe selection is related to the holding plan, observable time, and costs. Shorter timeframes produce more frequent signals, and spreads and slippage may account for a larger proportion of relatively smaller target moves; longer timeframes may increase stop-loss distance and holding time. There is no standard formula that "the daily chart is always right" or "three timeframes aligning means certain victory." Only by fixing the observation standard first can later records be compared.
First confirm location from the larger chart
When opening the daily chart, answer only a few basic questions: Are the most recent completed swing highs and lows rising or falling? Is the current price near the edge of a prior range, or in the middle? Has the most recent daily candlestick already closed, or is it still changing during the trading day? Save the highs, lows, and drawing time; do not use an unfinished daily candlestick to confirm an already determined trend conclusion.
Assume that in the teaching chart, the daily chart on the left is still a series of lower highs, while the one-hour chart on the right shows a local higher low. The latter can indicate short-term repair, but it does not automatically overturn the larger structure on the left. To discuss a change in daily direction, at least a real break of a pre-marked key high must be seen, along with how the structure holds afterward; a few one-hour bullish candlesticks are far from enough.
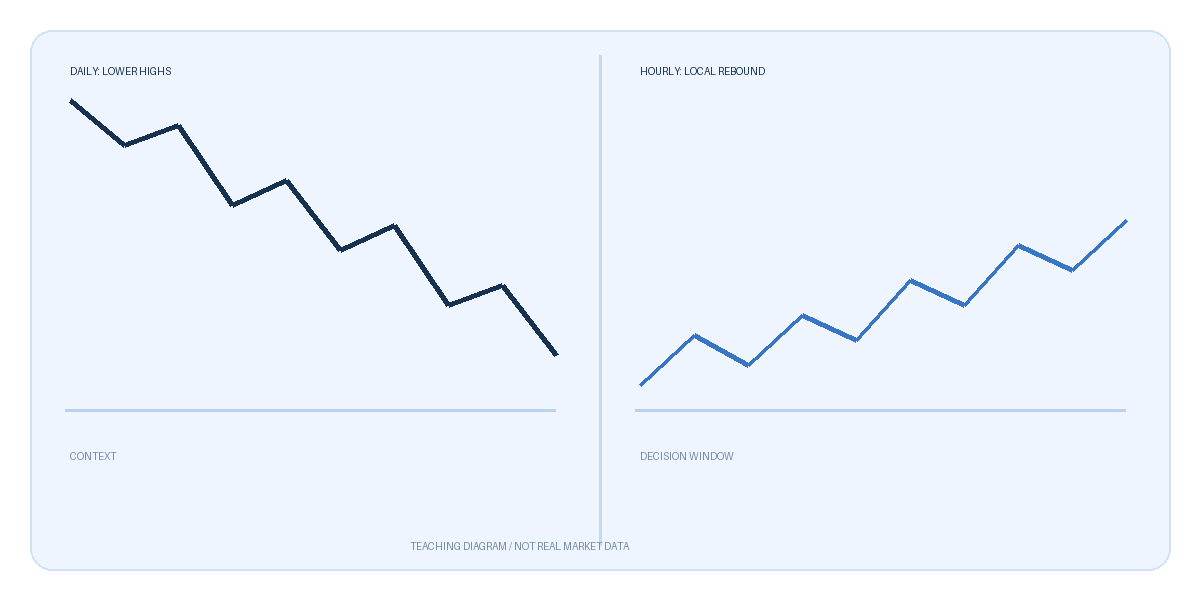
The two areas in the figure are different aggregation scales of the same concept, and real time and prices are deliberately not drawn. The left side illustrates the larger-level direction, and the right side illustrates the internal rebound. The image does not represent XAUUSD price action on any day, nor does it contain hidden buy or sell signals or backtest returns.
Then write two explanations clearly on the primary timeframe
If higher lows on the one-hour chart continue to form and price can stand above a pre-marked one-hour swing high, short-term repair can be observed; but if the daily chart is still falling, this repair is first defined as a rebound against the larger structure. Its invalidation condition is that the one-hour chart falls back below the low that formed the repair, returns to the original range, or shows a significant spread change. If the one-hour upward move is blocked and then forms a lower high, the weak interpretation may regain support; if price breaks above and holds above a key high on the larger timeframe, the original weak daily label also needs to be re-examined.
Here, "look at the daily chart" and "look at the hourly chart" are different responsibilities, not a requirement that they point in the same direction. The larger timeframe provides background and potential obstacles, the primary timeframe defines an observation that can be revoked, and the execution timeframe checks bid/ask prices and order details. If the three timeframes contradict one another and lack clear boundaries, temporarily drawing no conclusion is also a valid recorded result.
Four common mistakes
First, treating an unclosed daily candlestick as a confirmed pattern. Second, stitching candlesticks from different brokers while ignoring differences in server time zones, quotes, and weekend data. Third, comparing only direction without comparing price distance: even if the daily chart is bullish, the current price may be pressed right against marked resistance. Fourth, constantly changing parameters on small timeframes so that every turn on the historical chart is "just" predicted. The countermeasure is to save the original chart, platform, timeframe, parameters, and drawing time, and to record cases where the original judgment was overturned.
MT4 official documentation also notes that terminal chart candlesticks are drawn at the Bid price, while buy entries and sell exits are based on the Ask price. A touch on the technical chart may not be filled at the same price. Multi-timeframe analysis can only organize price information at different scales; it cannot eliminate slippage, leverage, or news risk; no combination of timeframes guarantees returns.

MT4 EA troubleshooting guides →