Gold rebound fails to reach channel upper rail: weakening trend or drawing deviation?
A smaller rebound within the channel is only an observational clue. Fix the anchors and coordinates, then examine the lower rail, local lows, and recovery process to avoid constantly moving lines to explain price action.
Author: Thomas | Technical Analysis | November 13, 2026
Summary: A rebound within an ascending channel that fails to touch the upper rail is easily interpreted as an imminent trend reversal. But whether price must touch the rail, whether the channel remains representative, and whether the anchors were adjusted after the fact all need to be checked first. This article discusses how to handle such incomplete signals, without using that day's gold price levels or real market screenshots.
A channel provides reference, not a requirement that price must reach it
A parallel trend channel is usually formed by a main trendline and another parallel line. For an ascending channel, a reviewable pullback low can first be used to establish the main line, then a relevant high to determine the parallel reference. Point selection involves judgment; different timeframes, wick or body conventions may produce different drawings, and no single line should be treated as a track the market must obey.
Here, channel refers to a manually drawn parallel trendline, not a Donchian channel calculated from the highest and lowest prices over a past number of bars, nor a Bollinger Band. Similar names do not mean the same algorithm. Channel educational materials from Fidelity and StockCharts both emphasize that breakouts are worth observing and require confirmation from other evidence, rather than a touch of the line necessarily implying a reversal.
Teaching scenario: rebound fails to touch the upper rail
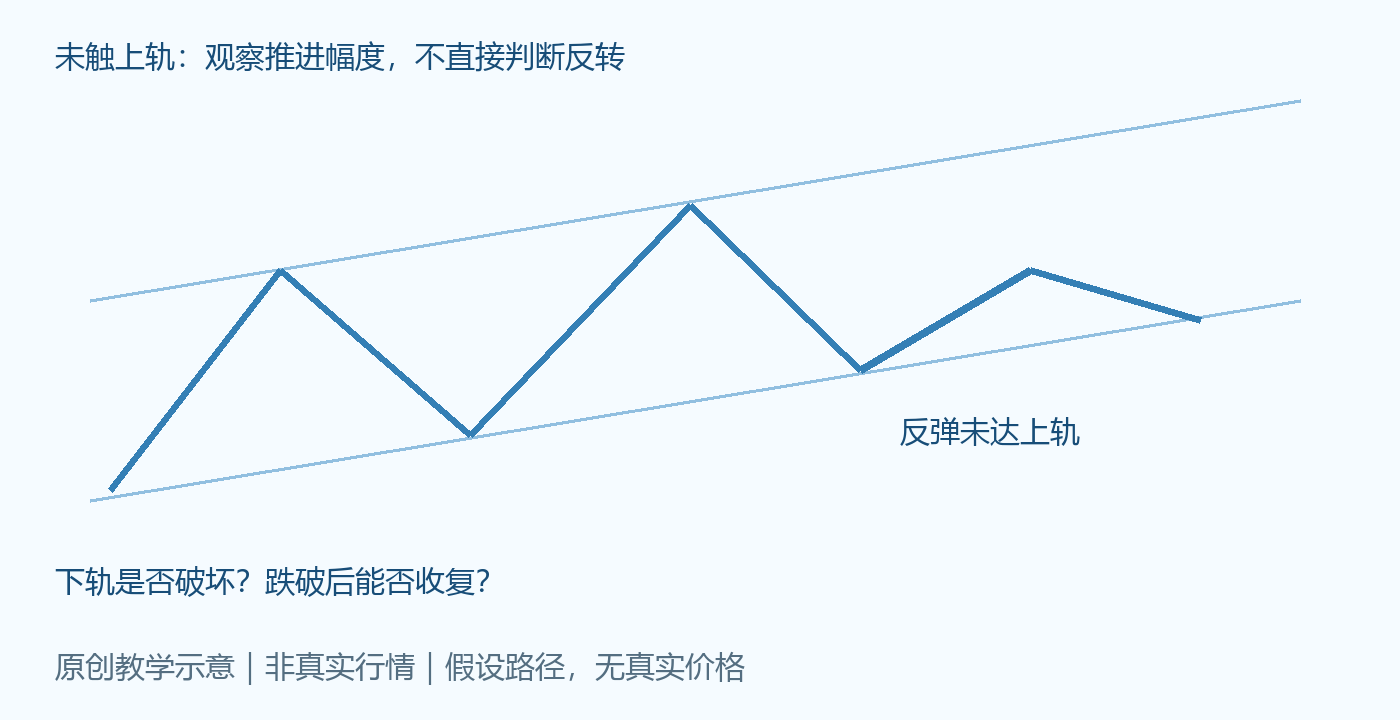
The image is an original teaching illustration, not real market data; the line segments represent only a hypothetical path. Price previously advanced within an ascending channel, and later a rebound fell back before reaching the upper rail. This can be described as a smaller advance relative to the channel reference, but it cannot independently prove that a downtrend has begun.
Possible explanations include temporary consolidation, volatility contraction, a channel drawn too steeply, or a genuine beginning of trend weakening. To distinguish these paths, one needs to look at local lows, the lower rail, and subsequent recovery; a definite target cannot be inferred from a single blank distance. The channel upper rail also rises as time advances, so a rebound failing to touch the line and price failing to make a new high are not exactly the same issue.
First rule out a change in drawing method
Record the time and price of the two anchors of the main line, then record the parallel reference point, and keep the screenshot or values from that time. Fix the timeframe, server time zone, and coordinate type; in particular, do not mix linear and logarithmic coordinates in a comparison. Long-span charts may show different slopes under different coordinates, so trend acceleration cannot be judged merely from the screen angle.
If the anchors are later moved every time price deviates so that it always stays within the channel, the channel loses its testing function. If redrawing is truly necessary, keep the old version and state why the new data invalidates the original drawing. A revised channel cannot be used retroactively to claim that a turning point had already been accurately predicted.
Then check whether price has actually broken the structure
After the failure to touch the upper rail, first observe whether the confirmed pullback low on the current timeframe holds. If the low is still rising and price subsequently crosses back above the local high, the structure may merely have slowed. If the low is broken, the selected timeframe closes outside the lower rail, and the rebound cannot recover, only then does the case for a weaker bias increase.
A single downward spike may be a brief overshoot; check the spread, quote side, and close. A break of the lower rail also does not automatically mean the long-term trend has reversed; the original channel may be replaced by a gentler advance structure. At that point, reassess within the same planning timeframe rather than arbitrarily switching to another timeframe to seek support.
How to identify failure of the original judgment
If the hypothesis "a rebound failing to touch the upper rail means weakening" is proposed, state in advance which changes would negate it. For example, if price crosses back above the corresponding rebound high and holds, or if the lower rail is broken and then quickly recovered with a retest that holds, these require withdrawing the one-directional continuation judgment.
A common teaching failure is to preset a reversal at the channel boundary in advance, then after price consolidates and continues rising, keep raising the upper rail to explain the outcome. Review should check the anchors and conditions at the time, not overwrite the original record with lines drawn later to fit better. The cases in this article are all hypothetical, not personal trading experience.
Applicable boundaries and risks
Parallel channels are better suited to phases with relatively clear structure and temporarily stable slope. Sudden gaps, dense overlap, or data anomalies reduce their explanatory power. One must not delete prices that do not match expectations in order to obtain a clear chart, nor mechanically project channel width as a guaranteed profit range.
Actual exits are also affected by spread, slippage, and liquidity, and confirmation signals cannot guarantee execution. Verify the drawing method first, then check the structure and invalidation conditions, and only then discuss whether the risk is bearable, so that the channel can serve as a reviewable auxiliary tool.

MT4 EA troubleshooting guides →