Gold's Long Lower Shadow Means It's About to Rise? Two Paths to Understand the Information Boundaries of a Candlestick
The same open, high, low, and close can come from different price sequences. With original educational charts, distinguish between shadow facts, causal inferences, and subsequent confirmation.
Author: Thomas | Technical Analysis | October 16, 2026
When a gold candlestick leaves a long lower shadow, a common explanation is that "someone caught it below, and it's going to rise next." The first half of that statement already adds inference, and the second half requires further evidence. A candlestick can show the open, high, low, and close over a period, but it cannot by itself prove participant identity, the complete order of transactions, or the direction of the next segment. Today, using two educational paths, we explain how to distinguish between facts on the chart and trading interpretations.
What a Single Candlestick Retains
The body of a standard candlestick connects the open and close, while the shadows extend to the highest and lowest prices of that period. A close above the lowest price indicates that at the end of the period the price did not remain at its lowest point; this does not mean knowing which type of funds bought, nor does it confirm that a certain support is necessarily valid.
Before analysis, first confirm whether the candlestick has finished forming. For a candlestick still forming, both its closing position and shadow length may change. Treating an intraday screenshot as the final form makes it easy to forget afterward that the original judgment used incomplete information.
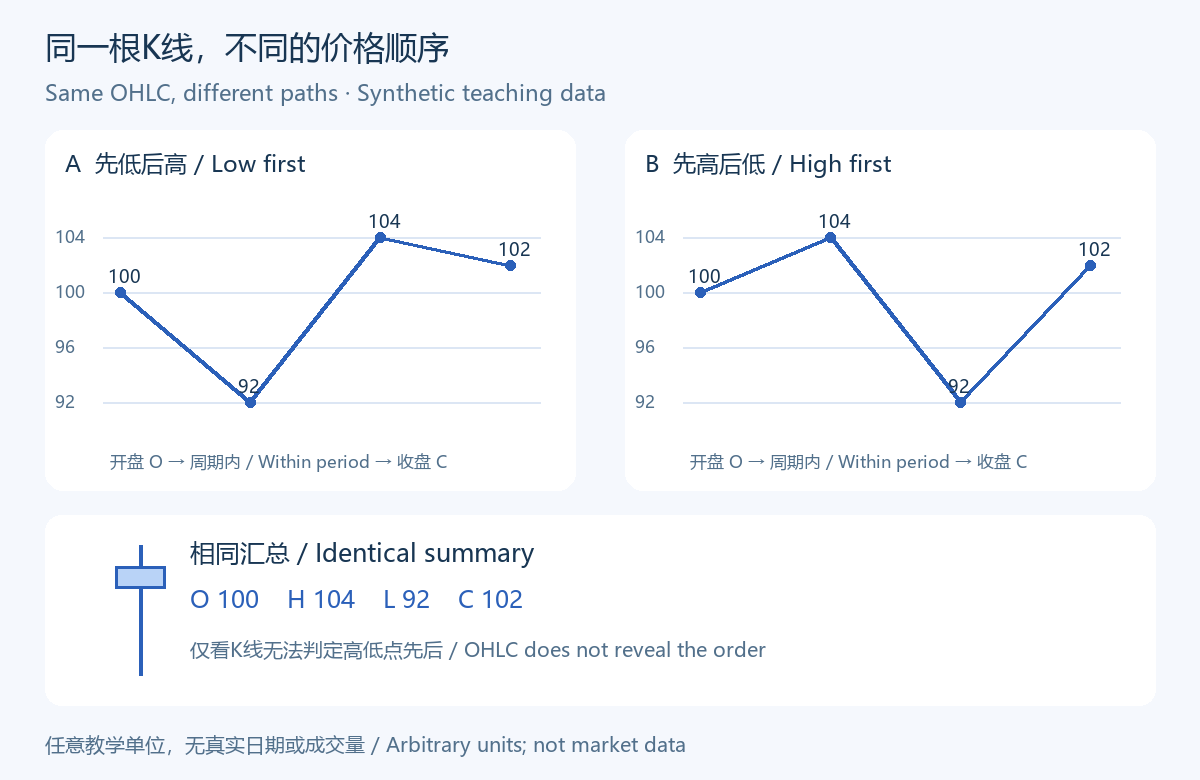
Chart: The Same Candlestick Can Come from Different Paths
The original chart uses arbitrary educational units: open 100, high 104, low 92, close 102. Path A is 100, 92, 104, 102 in sequence; Path B is 100, 104, 92, 102 in sequence. The four summary values of the two paths are exactly the same, so they will form the same standard candlestick.
But Path A reaches the lowest point first, while Path B reaches the highest point first. From this candlestick alone, it is impossible to determine the order of the high and low, let alone fill in the complete story of "sweeping stops first, then pulling up." The chart contains no real market dates, volume, or trading records; the lines are only counterexample illustrations and do not mean that real prices move in straight lines in every segment.
A Long Lower Shadow Is Not a Participant List
Interpreting the shadow as the action of a certain institution, main force, or specific order group requires additional evidence. Without tick-by-tick transactions, order records, or verifiable materials, the more prudent statement is that "this period once reached a lower position and returned above it by the end."
This sentence may not feel like a story, but it preserves what can be verified. Analysis does not prohibit proposing hypotheses; rather, it lets "observed patterns" and "inferred causes" be recorded in separate columns, avoiding writing speculation as if it were an established fact.
Position and Context Determine the Next Question
The same lower shadow appearing in the middle of a range, near a previous low, or during a sustained decline raises different questions worth asking. Position must come from a structure recorded in advance; one cannot wait until seeing the shadow and then arbitrarily draw a line and claim that the market accurately validated it.
First record the position of the pattern relative to the existing structure, then observe whether it subsequently holds, recovers, or weakens again. Do not use a single candlestick to replace the full context, and do not ignore that its period does not match the current trading objective just because the body color meets expectations.
Write Confirmation Conditions and Invalidation Conditions Together
One educational recording method is: mark the low and closing position of a completed candlestick, and clearly define what price behavior you expect to appear afterward. If price subsequently continues to move lower or the original holding condition is broken, re-examine the absorption hypothesis. Even if there is a brief rebound afterward, it does not automatically prove that the original judgment was correct all along.
How many candles to observe specifically and which period to use must be defined in advance in the method; this article does not provide a universal value applicable to all market conditions. This recording framework has not been validated for returns and should not be packaged as an entry system with a fixed win rate.
In Review, Keep Both Successful and Failed Samples
Keep similar patterns that later rose, continued to fall, and moved sideways, with fixed screening criteria and observation length. Selecting only long lower shadows that worked out afterward erases unsuccessful samples from the picture. To evaluate trading performance, one must also include realistically executable prices, costs, and exit rules.
This article does not provide current gold levels or live trading results. The chart illustrates the limitations of information aggregation, not a prediction outcome. Leveraged trading can cause major losses; charts can help organize observations, but they cannot replace risk assessment, nor do they guarantee the direction of the next candlestick.
MT4 EA troubleshooting guides →