How to Identify a Bullish Engulfing in Gold? Don't Mix Body Engulfing with Full-Candle Engulfing
Use original teaching charts to clearly explain the two common definitions of bullish engulfing, the prior trend, confirmation methods, and invalidation conditions, so you don't treat two candles as a confirmed reversal.
Author: Thomas | Technical Analysis | November 1, 2026
On a gold chart, if two candles are one red and one blue, and the second is larger, does that necessarily make it a "bullish engulfing"? Search results often describe it as a bottoming signal, but different schools are not entirely consistent on whether "engulfing" covers the body or the entire high-low range. This article only addresses identification criteria and verification steps. The images are original teaching illustrations and do not represent real XAUUSD market data or buy/sell signals.
Illustration: First, clarify what is being engulfed
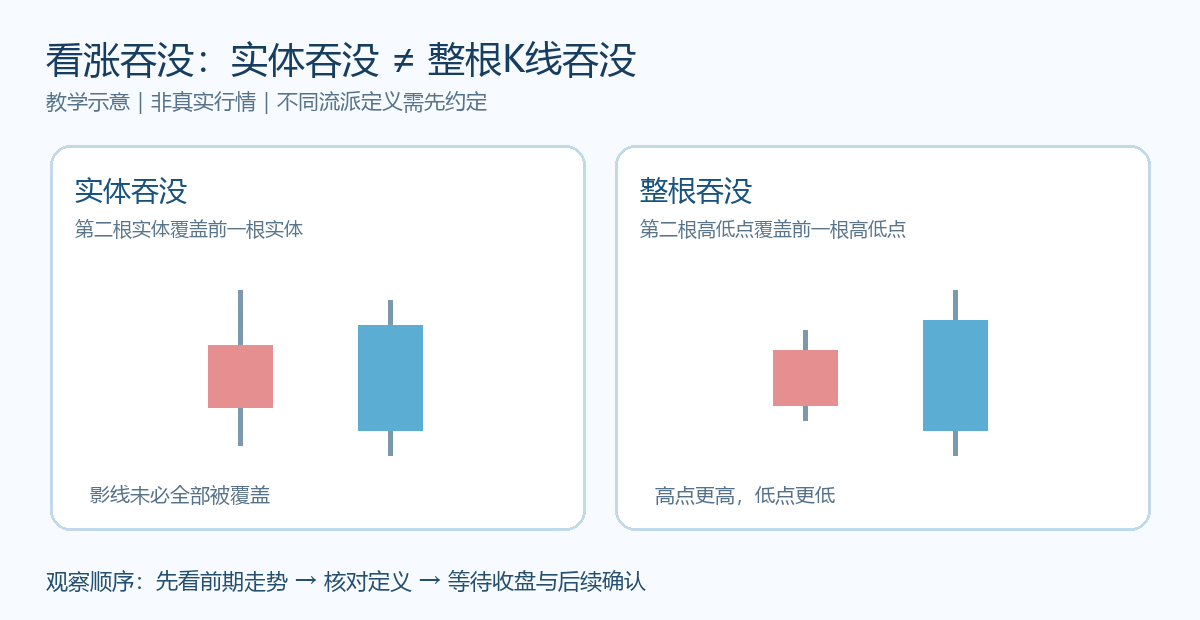
A candle body is the range from open to close, and the wicks mark the high and low prices for that period. The common bullish engulfing identification requires the previous candle to have a bearish body and the next candle to have a bullish body, with the latter body covering the former body. Some analysts use the stricter "full-candle engulfing," requiring the latter candle to have a higher high and a lower low. A technical article from the CMT Association explicitly notes that in markets trading nearly around the clock, the traditional gap-based definition may not appear often, so the author accepts the looser criteria of body engulfing or high-low range engulfing. The two criteria cannot be switched back and forth during backtesting, otherwise it is easy to cherry-pick good-looking samples after the fact.
Step 1: See where the pattern appears
A pattern name cannot be separated from the prior price action. If price has been weakening continuously and two opposite-direction candles appear near an observed support area, it at least suggests that selling pressure may be slowing; if the pattern appears in a strong uptrend, or is just random oscillation in the middle of a range, the same two candles do not necessarily mean "the decline is over." A review of candlestick teaching by the CMT Association also emphasizes that prior trend and market context should be checked before interpreting engulfing. Without context, labeling candles in isolation has limited meaning.
Step 2, fix the same timeframe. Engulfing on the daily chart and engulfing on the five-minute chart represent different observation lengths, and weekend and different brokers' daily cut-off times may also change candle shapes. In particular, OTC gold quotes are not a unified closing price from a single exchange, so you cannot directly use one platform's daily pattern as the precise entry basis for another platform.
Step 2: Wait for the candle to finish, then test what follows
The forming second candle may temporarily cover the previous one and then shrink back before the close, so identification should be based on completed candles of the chosen timeframe. The confirmation method can be specified in advance: whether the next candle continues to hold above the upper end of the engulfing body, or whether a pullback holds the low end of the pattern. If there is only a brief upward pierce followed by a pullback, it cannot be equated with sustained confirmation. The verification method here is a research framework, not the only rule that all traders must adopt.
Suppose in a set of teaching data, the previous candle opens at 100 and closes at 95, and the next candle opens at 94 and closes at 101. The latter bullish body covers the former body, so it can be recorded as "body engulfing." If the previous candle's high is 103 and low is 93, while the next candle's high is only 102 and low is 94, then it does not meet "full high-low range engulfing." These numbers are only used to illustrate the definition and are unrelated to real gold quotes. When writing a research log, record which criterion was used.
Common Misjudgments and Invalidation Conditions
The first misjudgment is treating a large bullish candle itself as reliable proof of reversal. If it appears amid extremely wide spreads after a major data release, and the next candle quickly breaks below the pattern low, the original repair interpretation is invalidated. The second misjudgment is ignoring location: a rebound candle during a decline may only be a temporary pause by sellers, after which price continues to make new lows. The third misjudgment is placing a stop-loss very close immediately after seeing the pattern, without considering normal volatility, trading costs, and gaps.
An actionable review method is to first fix the instrument, platform, timeframe, and engulfing definition, then record where it appeared, the direction of the next three to five candles, and the proportion of cases in which the pattern low was broken. Keep both positive and negative cases; do not show only successful rebounds. If results are unstable across different periods and volatility environments, reliance on the pattern should be reduced. No candlestick pattern can guarantee a reversal; leveraged trading may amplify losses, and this article is for teaching purposes only.

MT4 EA troubleshooting guides →