Gold Rebounds After Support Break: How to Judge a Failed Role Reversal?
Former support may turn into resistance, or it may be reclaimed. Use a dual-path teaching diagram to explain retest confirmation, invalidation conditions, and ex-ante records.
Author: Thomas | Technical Analysis Experience | November 6, 2026
Abstract: After gold breaks below a support area and rebounds, should it be regarded as resistance? Role reversal in technical analysis is an observational hypothesis awaiting verification, not a rule that price must obey. In practice, the key is to record in advance the basis for the area, the manner of the break, and the conditions for reclaiming it, so as to avoid concluding that a decline is certain as soon as a rebound approaches former support. This article uses an original dual-path teaching illustration and does not involve same-day trading levels or live trading experience.
Why Former Support Is Worth Continued Observation
Support usually refers to an area where downward price movement was previously impeded; after a break below, that level may become resistance in a subsequent rebound. Past trading and participant behavior may keep the area in focus, but candlestick charts alone cannot prove specific holders, order quantities, or their intentions. Understanding role reversal as an observation level is more helpful for recording and testing than inventing a story that "major players will definitely sell here."
An area should first come from price reactions that have already occurred, such as a relatively clear swing low or a range of repeated pauses on the same timeframe. When drawing, fix the platform, instrument, and timeframe, and use an area rather than an extremely thin line to accommodate normal quote differences, but the width of the area must not keep expanding along with losses. A level without a clear historical reaction should not be called strong support merely because an integer is easy to remember.
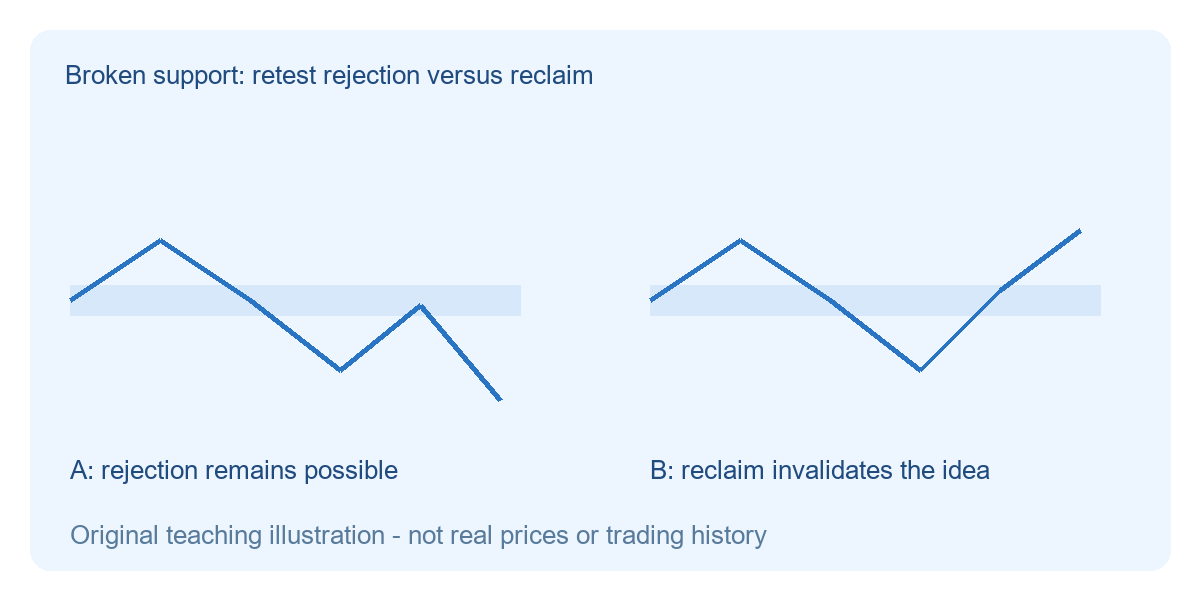
The light blue band represents the hypothetical former support. In the left chart, price breaks below, rebounds into the area, and weakens again, showing a path in which resistance conversion may be supported; in the right chart, the rebound reclaims the area and continues upward, showing a path in which the original judgment is negated. Both are conceptual diagrams, use no real gold quotes, and do not indicate the probability of either path occurring.
Check the Retest with Three Questions
First ask whether the break below has been confirmed. A single lower wick poking out and immediately retracting is different from a close outside the area on the chosen timeframe that continues to hold. Second ask where the rebound returns to: merely approaching the area, entering the area, or closing back above the area cannot be treated as one state. Finally ask whether the subsequent structure cooperates: only when the rebound high is capped and price then declines again is there one more layer of evidence than a mere touch.
A candidate rule can be recorded in advance: after a break below on the execution timeframe, if the rebound fails to reclaim the area and price then breaks below the local low of the rebound process again, only then continue to assess the weaker scenario. This is only a teaching process, not the sole standard that all traders should adopt. Waiting leads to later judgments and may miss a direct decline; these costs should be evaluated together with the reduction in misjudgments.
Failure Scenarios Must Be Written Down in Advance
If price moves back above the area and holds the reclaim in a subsequent retest, the judgment that former support has turned into resistance needs to be downgraded or withdrawn. One cannot see the reclaim while redrawing a higher level as the "real resistance" to preserve the original view. If the originally designated judgment timeframe has not yet closed, it should also be acknowledged that the conclusion is still unconfirmed.
Another type of failure comes from environmental change: major news causes quotes to jump, and a range that formed slowly may be crossed rapidly; differences in spreads or daily rollover conventions across platforms can also make charts differ. In such cases, first verify the data and execution conditions, then decide whether the original area still applies. Invalidation of role reversal does not automatically mean one can chase in the opposite direction; a new direction still requires independent grounds.
How to Keep Useful Review Records
Save the time the area was first drawn, the structure visible at that time, the predetermined confirmation rules and negation conditions, and then record the actual subsequent performance. Only by keeping both successful and failed samples can one judge whether one is mistaking hindsight charts for ex-ante identifiable signals. Do not select only the few charts where the rebound happened to be rejected to prove the method works.
This framework suits charts that already have clear areas and a retest process; when price moves back and forth in a disorderly way and areas are difficult to define objectively, its applicability decreases. Even if a chart meets the conditions, spreads, slippage, and exit execution will still affect the result. The risk limit should be set before action, and no support-resistance method can guarantee returns.

MT4 EA troubleshooting guides →