Gold breaks out then falls back into the range: how to identify a false breakout?
From drawing the range in advance, confirming with the close, to the retest and invalidation conditions, with an original light-blue educational chart, avoid writing an intraday pierce as a valid breakout.
Author: Thomas | Technical analysis experience | October 23, 2026
Seeing price briefly push out of a consolidation zone on the chart and immediately writing down "breakout confirmed" is a common shortcut in technical analysis. Price briefly crossing a boundary and then closing back inside the original range is not the same thing as a valid departure from the range. Fidelity's chart education calls the situation where price returns almost immediately to within the original breakout price after a breakout a false breakout; if a reverse breakout follows, it may form a more complex failed breakout. This article uses only original illustrative diagrams to explain how to preserve evidence in advance, and does not correspond to today's gold price levels.
First fix the original range
To discuss a breakout, there must first be an identifiable range or resistance. It is best to mark two or more swing highs, lows, and the chosen chart timeframe before price approaches the boundary, while saving the original chart. Range edges are usually not a mathematically precise line: different platforms' bid and ask quotes, wicks versus closing prices, time windows, and spreads may all cause the boundary to differ slightly. If the upper edge is moved every time a new candlestick appears so that the historical price action always appears to "just break out," the judgment cannot be reviewed.
For example, using purely educational coordinates, set the upper edge of the range at 100 and the lower edge at 90. Price spikes to 102 intraday, but the timeframe closes at 99, so one can only say price briefly crossed above the upper edge intraday, not that the close confirmed it. The 90, 100, and 102 here are not real gold quotes, nor do they represent actual stop-loss or pending-order levels on any platform. Conversely, if the chosen timeframe closes outside the upper edge, that only adds one piece of evidence and does not guarantee that the next timeframe will continue rising.
After a breakout, do not omit "where it returns to"
First check whether the crossing occurred on an unfinished candlestick or a completed candlestick; then check whether the distance price moved away from the boundary is clearly greater than the platform's normal spread and short-term noise; next observe whether the following one or two completed timeframes remain outside the boundary or immediately return inside the original range. Finally, record the retest: whether a new higher low can form near the original upper edge, or whether price falls back to the middle of the box. There is no universal "must be two candlesticks" formula here; the key is to fix the observation timeframe and cancellation rules in advance.
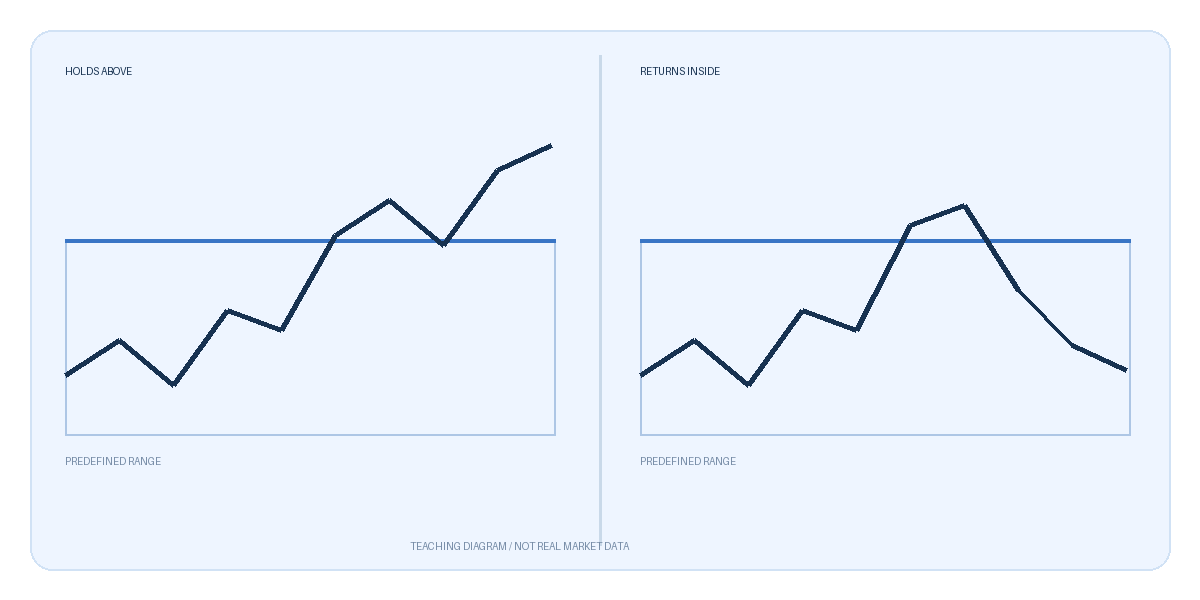
The educational line on the left of the chart retests and holds above the upper edge of the range after crossing it, while the one on the right briefly pierces out and then returns into the range. The two paths may look very similar at the moment of the initial pierce. The diagram has no real quotes, trading dates, or profit records; it is meant to remind readers to preserve the original judgment conditions rather than, after the outcome appears, pick a stretch of candlesticks that favors them.
Two scenarios and their respective invalidation conditions
If a completed timeframe steadily closes outside the original boundary, the retest does not re-enter the range, and price forms a higher low at the same time, then the breakout continuation scenario has further observational value. The invalidation condition is that price later returns inside the original range, especially if it cannot get back outside the boundary on the same timeframe. At that point, the original "continuation" interpretation should be withdrawn, rather than calling the invalidation a "cheaper breakout entry."
If price rushes out and then quickly re-enters the range, the false breakout scenario better fits the observed evidence. But this also does not automatically mean price will necessarily reach the other end of the box. If price once again stands back outside the original boundary and completes a retest, the original false breakout interpretation should be given less weight. Both scenarios should check the lower boundary, transaction costs, and whether news events have changed the volatility structure.
Mistakes often occur at the execution level
Looking only at the midpoint price of candlesticks while ignoring bid and ask may treat a crossing that cannot be executed at the same price as a signal; during rapid volatility around data releases, stop-loss trigger prices and execution prices may also differ. Altering the range, timeframe, and filter rules after the fact to make historical cases look good creates an unrepeatable accuracy rate. A better research record includes the original chart time, platform, quote type, range drawing method, breakout close and retest results, and which examples overturned the original judgment.
A range breakout is an observational framework, not a rule that guarantees returns. Even if all conditions were met at the time, the next step may fail; even if a false breakout is seen, one cannot infer that a reverse trend must follow. Leveraged trading can cause significant losses, and position size and stop-loss cannot be determined by a single chart pattern.

MT4 EA troubleshooting guides →