Should You Wait for a Pullback After Gold Breaks Above the Prior High? Use Three Checks to Avoid False Breakouts
Breaking above the prior high does not mean the trend is confirmed. Use original educational charts to lay out the prior-high zone, candlestick closes, pullbacks, and new highs, and list invalidation conditions.
Author: Thomas | Technical Analysis Experience | November 2, 2026
When the gold price crosses above the prior high, the word "breakout" often appears on the chart immediately. But a single candlestick passing through a horizontal line may be the start of a new leg higher, or it may just be a brief pierce during thin liquidity. What we discuss today is not a specific real-time price level, but the execution sequence for reviewing a pullback after a breakout: first identify the prior-high zone, then look at the close after the cross and the pullback, and finally write down what would invalidate the original judgment. The image is an original educational illustration, not a live-trading screenshot or a record of returns.
Illustration: The First Cross Is Not All the Evidence
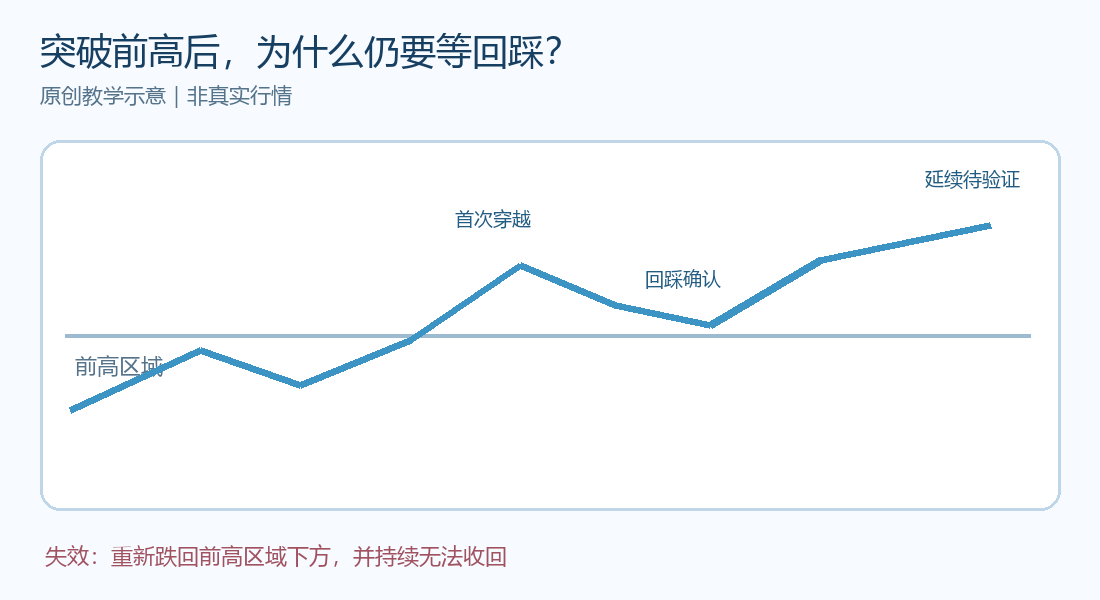
The horizontal band in the image represents the prior-high zone that had been traded multiple times before. The blue line crosses above it for the first time and then pulls back, after which it rises again above the zone. Only when the pullback does not persistently fall back into the original zone and subsequent highs and lows continue to move up is the continuation interpretation better supported. If price quickly returns inside the zone after the cross, the original breakout interpretation should be withdrawn. The illustration does not correspond to any real gold quote, and the distances or angles in the image should not be converted into specific stop-losses.
First Determine Whether the "Prior High" Is Worth Watching
An isolated spike is usually not enough to represent resistance that the market collectively watches. Observers can identify, on a fixed timeframe, a price band where price previously rallied and fell back multiple times, and note the width of that zone, when it formed, and the trading session. CME's technical analysis education notes that a chart's open, high, low, and close are objective data, but pattern interpretation is subjective; support and resistance need to be combined with prior highs and lows and price behavior. When drawing lines, do not keep shifting the zone boundaries after the fact just to make this breakout look clean.
Over-the-counter XAUUSD quotes for gold are provided by different service providers. A momentary high shown on platform A may not be the same as on platform B; daily candle cut-off times may also affect which candlestick the "prior high" falls on. When reviewing, keep the same platform, instrument, and timeframe to avoid using a Kitco spot high to judge whether a broker's quote has already broken out effectively. If using real market charts, also save the quote time and time zone; the chart in this article serves only an educational purpose.
Three Checks to Judge Whether It Is Continuation or a False Breakout
The first check is the closing position after the candlestick completes, not just the intraday pierce. If the close is still above the prior-high zone, it can temporarily be listed as a breakout awaiting confirmation. The second check is the subsequent pullback: does price turn old resistance into a new support watch zone, or does it fall back into the zone and remain capped? The third check is whether price can make a new higher high after the pullback. If it keeps failing to advance, the breakout may also degenerate into range-bound trading. CME's reversal pattern course likewise reminds that patterns need confirmation, and a single high may evolve into a double top or more tests; this cannot be mechanically turned into a certain prediction, but it shows that the subsequent path cannot be omitted.
A pullback is not guaranteed to happen. Some strong trends may rally directly without offering a neat pullback, and those who wait will miss a stretch of the move. Missing it is not evidence that the method is wrong; the purpose of a method is to write down clearly the confirmation conditions and risk boundaries needed before entry. If, in order not to "miss out," you change to chasing every pierce, then backtesting and live trading no longer use the same set of rules.
Invalidation Conditions and Failure Samples
Suppose the research plan requires price to close above the prior-high zone on an hourly close and to remain above it after a pullback. If the next large decline follows and consecutive hourly closes are below the zone, the original breakout hypothesis is invalidated; if price later reclaims it, it can be watched again, but the failed first signal must not be deleted from the record. Another kind of failure is when price, although holding above the zone, repeatedly fails to make a higher high; in that case the judgment of "strong continuation" should be lowered, rather than maintaining the view indefinitely just because the line has not broken.
The review log should save samples of successful breakouts, brief pierces, and no-pullback cases alike, and record spreads, slippage, and data release times. If most of the profit comes from a few extreme samples, or if slightly changing the zone width completely reverses the result, the rules are not robust. In leveraged gold trading, adverse volatility may expand before price moves in the favorable direction; pattern alone cannot guarantee that a stop-loss will be filled at the preset price. This article is for methodological research only and does not constitute buying or selling advice.

MT4 EA troubleshooting guides →