Gold breaks out then falls back into range: how to review a "false breakout"?
Use four steps—range boundaries, closing position, retest, and invalidation conditions—to review a failed breakout, and avoid redrawing the line standard after the fact or mistaking quote spikes for a trend.
Author: Thomas | Technical Analysis | October 28, 2026
When one candlestick just crosses above the upper edge of a range and the next quickly returns to the original range, breakout chasers may call it a "false breakout." The difficulty is not labeling the chart after the fact, but writing down in advance, while the breakout is still unconfirmed, which evidence supports continued observation and which changes invalidate the original judgment. This article uses fictional charts to illustrate a review method; it does not represent today's gold market and does not provide real-time levels.
First define the boundary you want to observe
The upper edge of a sideways range usually comes from a level that has been rejected multiple times over a period, and the lower edge comes from a level that has repeatedly stopped falling. Boundaries are better viewed as price zones rather than magic straight lines precise to one decimal place. First choose the chart timeframe, record the start and end times and the high and low points that formed the range, and then decide whether you are observing an "instant pierce," a "close above on that timeframe," or a "breakout followed by a retest that still holds." These three standards may produce different conclusions; you cannot change the rules only after seeing the result.
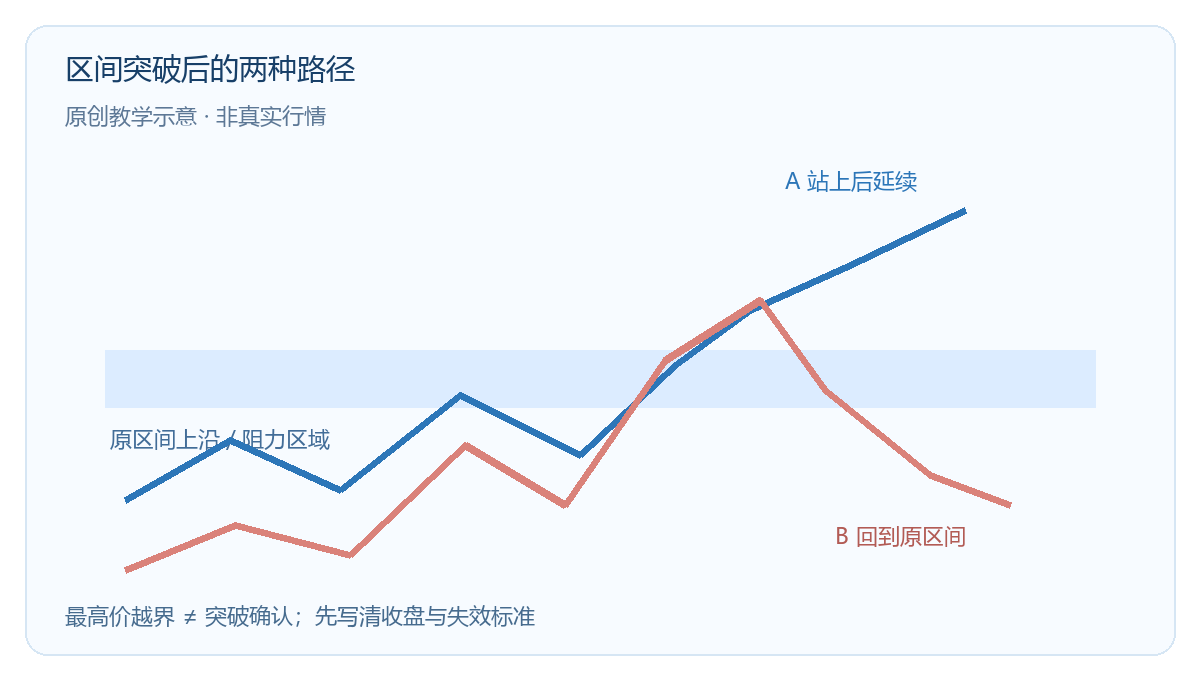
The blue band in the chart represents a hypothetical resistance zone. Path A crosses through and remains outside the range; Path B briefly crosses through but returns inside the band. There are no real quotes or times here. The purpose of the chart is to remind you: the high price exceeding the boundary only proves that price reached there, not that the market accepted a new range.
Break the review into four steps
Step one: write down the trading hypothesis before the breakout. Is the original range clear enough? If the upper edge of the range itself keeps moving, the so-called "breakout" may simply reflect a different way of drawing the line. Step two: observe whether the closing position and the following few candlesticks remain outside the range, but do not treat numbers such as "must be two consecutive candles" as a universal law; different timeframes and volatility environments need independent testing.
Step three: during the retest, see whether the old resistance zone temporarily turns into support. If price quickly falls back into the original range and again fails to reclaim it, the original breakout hypothesis should be reassessed. Step four: check the spread, news, and trading session at the time. Quote spikes during high-volatility sessions may trigger stops or pending orders; the chart close may look calm, but actual execution costs can be clearly different.
Separate two types of invalidation conditions
For the idea that "the breakout will continue upward," falling back into the original range and staying there is invalidation evidence to watch for; for the idea that "this is a false breakout," if price reclaims the range and continues, you cannot keep insisting on the pullback judgment. Such conditions should be written down before trading; otherwise, the same chart can always be interpreted in whatever direction you want.
A failed breakout sometimes triggers a relatively quick reverse move, but that does not mean a major trend will necessarily form. The market may re-enter a range or break out again. Writing off a single pullback directly as "smart money luring bulls" requires additional evidence such as trading orders; candlesticks alone cannot prove the intentions of any type of participant.
Situations where misjudgment is especially likely
Ranges that are too narrow, samples that are too few, and different candlestick closing times across platforms can all change the boundary. For off-exchange XAUUSD, MT4 volume bars are usually quote update counts; do not directly treat high bars as confirmation of real global trading volume. Around data releases, wider spreads and slippage may also prevent a breakout strategy on paper from executing at the assumed prices.
A more practical approach is to save screenshots before the breakout, the decision rules, and the invalidation conditions, and then record the execution results. During review, collect successful, failed, and untriggered samples together to test whether the rules really improve judgment. Confirmation steps may reduce some impulsive entries, but they may also miss part of the move; no confirmation method can eliminate false breakouts or guarantee returns.

MT4 EA troubleshooting guides →