What does a gold Bollinger Bands %B greater than 1 mean? First verify the ratio and closing price
Use hypothetical prices to calculate Bollinger Bands %B, distinguish between 0-to-1 and percentage displays, and explain how to verify price behavior after it exceeds the upper band.
Author: Thomas | Technical Analysis Tutorial | November 9, 2026
Summary: When using the 0-to-1 ratio convention, a gold Bollinger Bands %B greater than 1 means the selected price is above the current upper band. Some software multiplies the same reading by 100 for display. This article uses original illustrative diagrams to explain the calculation and verification steps, then explains when this reading is insufficient to support a trend judgment.
Step 1: Confirm the reading convention
The formula is (selected price minus lower band) divided by (upper band minus lower band). Common implementations use the closing price, but also check whether the software allows changing it to another input. Under the ratio convention, the reading is 0 when the price is at the lower band, 1 at the upper band, and 0.5 when it is exactly midway between the two bands. Above the upper band it exceeds 1, and below the lower band it is less than 0. Software using a percentage scale displays 0, 100, and 50 respectively, with the same relationships in between.
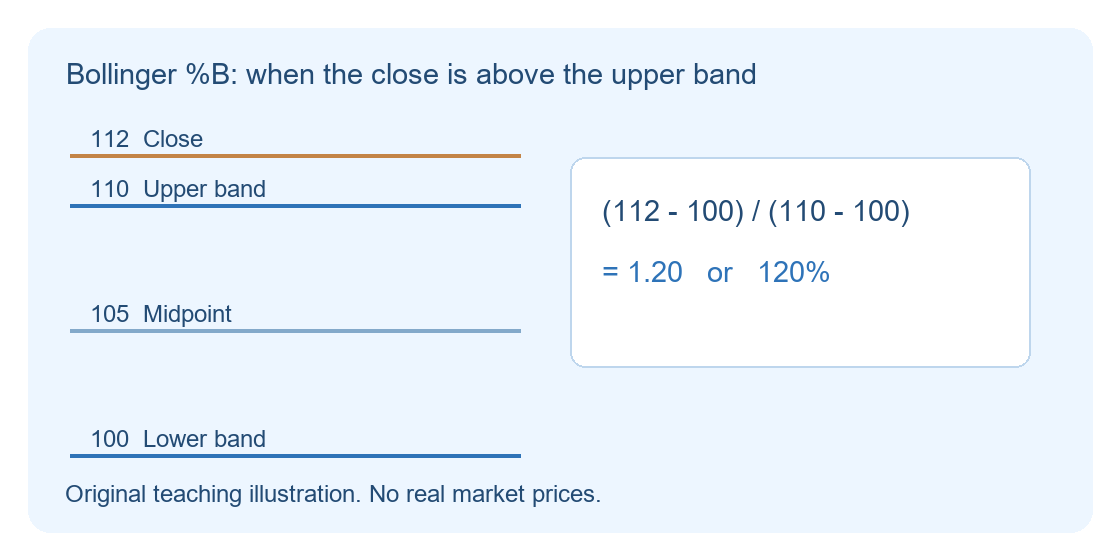
In the figure, assume the lower band is 100, the upper band is 110, and the current closing price is 112. The calculation is (112 minus 100) divided by (110 minus 100), giving 1.2, or 120 on the percentage scale. If the closing price is 105, the same upper and lower bands give 0.5. The values in the figure are teaching units only; no actual gold quotes or account records are used.
Step 2: Check the three numbers on the same candlestick
When calculating by hand, the closing price and both bands should all come from the same completed candlestick. If you compare the previous upper band with the current price, you are calculating the position relative to the old boundary, and the result may not match the platform's current indicator. When the live candlestick is not yet complete, both the price and the bands may be updating, and a brief intraday move above 1 may have disappeared by the close. Recording the chart timeframe, parameters, price input, and closing status helps with later review.
Even if the price is the same at two points in time, changes in the bands will change %B. For example, when the two bands narrow, the same price offset may correspond to a larger proportional change. %B describes the price's position within the band, while bandwidth describes the distance between the upper and lower bands. When analyzing, record the two side by side to avoid attributing all proportional changes caused by narrowing bands to accelerating prices.
Step 3: Verify the observation with subsequent prices
In a market with a clear direction, multiple closes may be near the upper band and occasionally beyond it. %B greater than 1 alone cannot determine whether the next candlestick will pull back or continue to strengthen. If observing trend continuation, you can also record whether highs and lows are rising and whether the price can maintain structure after a pullback. If the price returns inside the band and breaks below a predefined local low, the original continuation scenario needs to be reassessed.
In a range-bound market, a close outside the upper band may also be quickly pulled back. If observing mean reversion, first check whether the range boundaries are clear and whether there is follow-through after the price returns inside the band. If the price continues to make new highs and stays outside the original range, the reversion assumption should be withdrawn. You cannot change parameters or definitions only after the outcome appears and explain every sample as a success.
Which readings to set aside for now
When the upper and lower bands are equal, the denominator is zero, and the formula has no interpretable ratio result. When bandwidth is extremely narrow, slight quote differences or rounding may also cause large changes in the reading. Data gaps, inconsistent time zones, and unclosed candlesticks can also affect comparisons. Check the raw quotes first, then evaluate the pattern. Actual trading also involves spreads, slippage, and position sizing; a single ratio reading cannot provide an acceptable loss level or guarantee execution.

MT4 EA troubleshooting guides →