After a Gold Bollinger Band Squeeze, Will Price Rise or Fall? Watch Bandwidth, Range, and Breakout Confirmation
A Bollinger Band squeeze only describes volatility compression; it cannot predict direction. Illustrated explanation of bandwidth, price range, breakout confirmation, and failure conditions for false breakouts.
Author: Thomas | Technical Analysis | November 4, 2026
Summary: Gold Bollinger Bands gradually narrowing is often called a "squeeze." It indicates that recent price volatility has relatively decreased; bandwidth alone cannot determine whether the next move will definitely be up, down, or even necessarily an immediate breakout. This article uses original illustrative diagrams to explain the calculation logic, usage steps, common misjudgments, and failure conditions. The diagrams contain no real market data.
What Exactly Is a Bollinger Band Squeeze
Common Bollinger Bands use a 20-period simple moving average as the middle band, with the upper and lower bands placed approximately two standard deviations on either side of the middle band. Standard deviation describes the dispersion of recent prices relative to the mean; when volatility shrinks, the distance between the upper and lower bands narrows, and when volatility increases, it widens. The 20-period and two-standard-deviation settings are common starting points, not the only parameters suitable for all instruments and timeframes. Changing the period, data source, or closing price convention will change the chart.
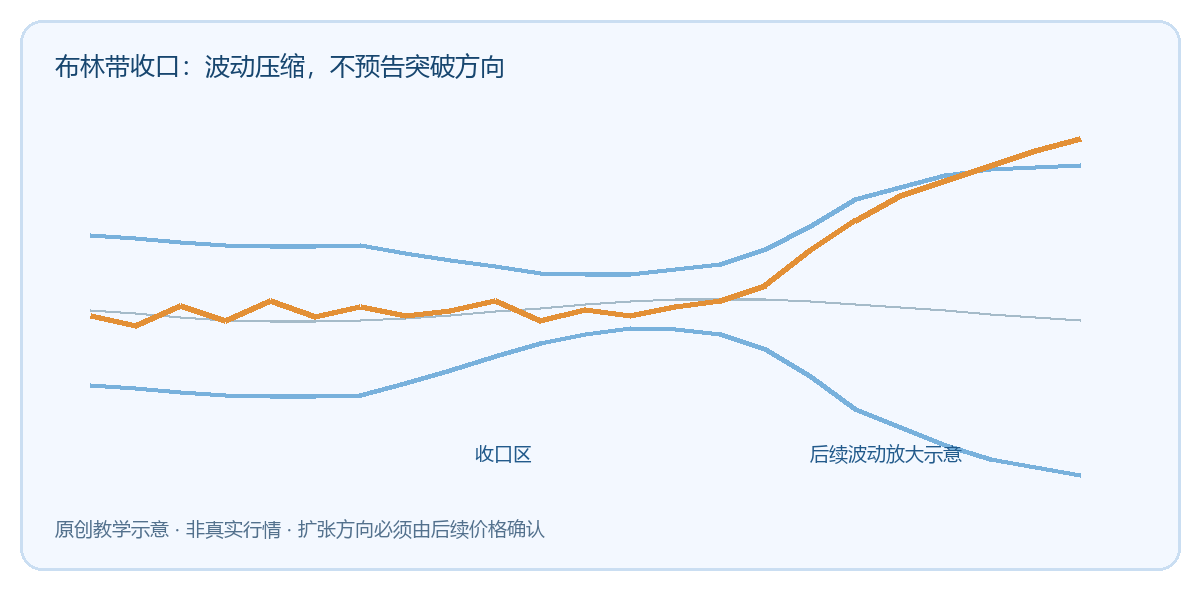
In the image, the light blue upper and lower bands converge in the middle section, and the orange price line subsequently moves upward. It shows only one possible path; an identical squeeze could also expand downward, or break up first and then fall back into the range. When judging, one must not write "squeeze" as a buy signal just because an upward arrow is drawn. The official rules of Bollinger Bands inventor John Bollinger also clearly state that price touching the upper band is not in itself a sell signal.
Three Steps to Turn a Squeeze into a Reviewable Observation
Step one, fix the observation object: record the platform used for XAUUSD, the candlestick timeframe, time zone, moving average period, and standard deviation multiplier. Then define what constitutes a "squeeze," for example comparing the current bandwidth with the bandwidth distribution over a past period on the same timeframe, and observing whether it is within a preset low range. Without prior definition, when reviewing charts it is easy to pick out only the narrow-band segments that were later followed by large moves.
Step two, observe the price structure near the squeeze: are recent highs and lows gradually converging, or did bandwidth drop sharply merely due to a data gap? If price continues to oscillate within a short range, first record the upper and lower edges of the range on the same platform. Bollinger Bands describe the volatility state; direction still needs to be verified by which boundary price breaks, whether it can close outside the range, and whether a retest holds. Different trading platforms' spreads and candlestick day boundaries may produce different results.
Step three, write down confirmation and failure conditions before observing. For example, only record it as an upside breakout attempt if a close on the same timeframe crosses above the upper edge of the range and the next candle maintains it; if the close quickly returns into the range, the attempt has failed. Symmetrical rules can be used for downside breakouts. Never keep changing judgments on a candle that has not yet closed. When backtesting, record samples of no breakout, false breakout, and continuous expansion, rather than keeping only "successful" cases.
Why a Squeeze Does Not Guarantee an Immediate Big Move
Low bandwidth is relative to a past period; low volatility can persist for a long time. Official Bollinger Bands materials treat a squeeze as a contextual clue that future volatility may expand, while also stating that the squeeze itself is not an independent trading signal. When the market enters holidays, trading session transitions, or lacks catalysts, price can continue to move sideways; when major data arrives, spreads and slippage may also expand with volatility. In both cases, "waiting for volatility to expand" and "being able to enter safely" are not the same thing.
Common Mistakes and Risks
There are three common mistakes: shorting upon seeing the upper band; going long upon seeing the lower band; and retrospectively inferring from the move after the bands expand that direction could have been predicted at the time of the squeeze. When the trend is very strong, price may run along the upper or lower band; touching a band does not equal a reversal. If the breakout price you set happens to fall within the normal spread variation range, the chart may appear to break out while the actual executable quote may not give the same signal. Gaps or rapid retracements may also occur during news, making preset stop-losses impossible to execute precisely.
If the first breakout after a squeeze fails to hold and price returns to the original range, the original breakout scenario should be judged as failed; if bandwidth continues to narrow and no direction is chosen, continue waiting. Using Bollinger Bands to study gold requires recording structure, costs, and risk budget at the same time. This article is for technical analysis education only and does not constitute trading advice or a guarantee of returns.

MT4 EA troubleshooting guides →