Gold ATR Rising: Buy or Sell? True Range Calculation and Direction Misconceptions
ATR measures volatility, not price direction. A light-blue original diagram explains the three TR calculations, the order for reading ATR, common misuses, and failure conditions.
Author: Thomas | Technical Analysis Tutorial | October 21, 2026
When searching for "gold ATR rising: buy or sell," it is easiest to conflate volatility and direction into a single signal. ATR stands for Average True Range; it answers "how large is the fluctuation range of each recent price bar," not "which way the next bar will definitely go." Both sharp rallies and sharp selloffs can make ATR rise. Below, calculation steps and a diagram explain how to use it and when to abandon using it alone to judge the market.
What ATR Is Actually Calculating
True Range (TR) takes the maximum of three values: the current period's high minus low; the absolute difference between the current period's high and the previous period's close; and the absolute difference between the current period's low and the previous period's close. Including the previous close is meant to incorporate gaps or cross-period gaps into volatility. ATR then averages consecutive TR values, with a common parameter of 14 periods. The indicator descriptions from Fidelity and MetaTrader 4 both classify it as a volatility indicator; the same 14 periods have different meanings and units on a five-minute chart versus a daily chart.
Using purely instructional numbers: if the previous close is 100, and the current bar's high is 108 and low is 103, then the three values are 5, 8, and 3; TR takes 8, not just the high-minus-low value of 5. These numbers are not gold quotes. ATR must also be combined with multiple prior TR values; you cannot claim directly from a single candlestick that "ATR equals 8." Different software initialization and smoothing methods may also cause slight differences in starting readings.
First Determine Chart Conditions, Then Look at the Slope
Step one: fix the instrument, platform quote, timeframe, and ATR parameters, and record whether the current ATR is presented in quote units, points, or a platform-specific display method. Step two: compare the ATR of recent completed periods with an earlier baseline, and do not substitute an unclosed spike for the final reading. Step three: return to the price chart to confirm direction and structure: are highs and lows rising, falling, or merely moving back and forth between the two ends of a range? Step four: write expectations and failure conditions in the record.
For example, if ATR rises continuously while price breaks below the lower edge of the original range, this only means volatility expanded during the decline; you cannot infer from ATR alone that the decline will continue. If price subsequently recovers into the range, the earlier "sustained breakdown" interpretation should be withdrawn. If ATR falls, it only means recent volatility has narrowed; it does not guarantee an immediate range breakout.
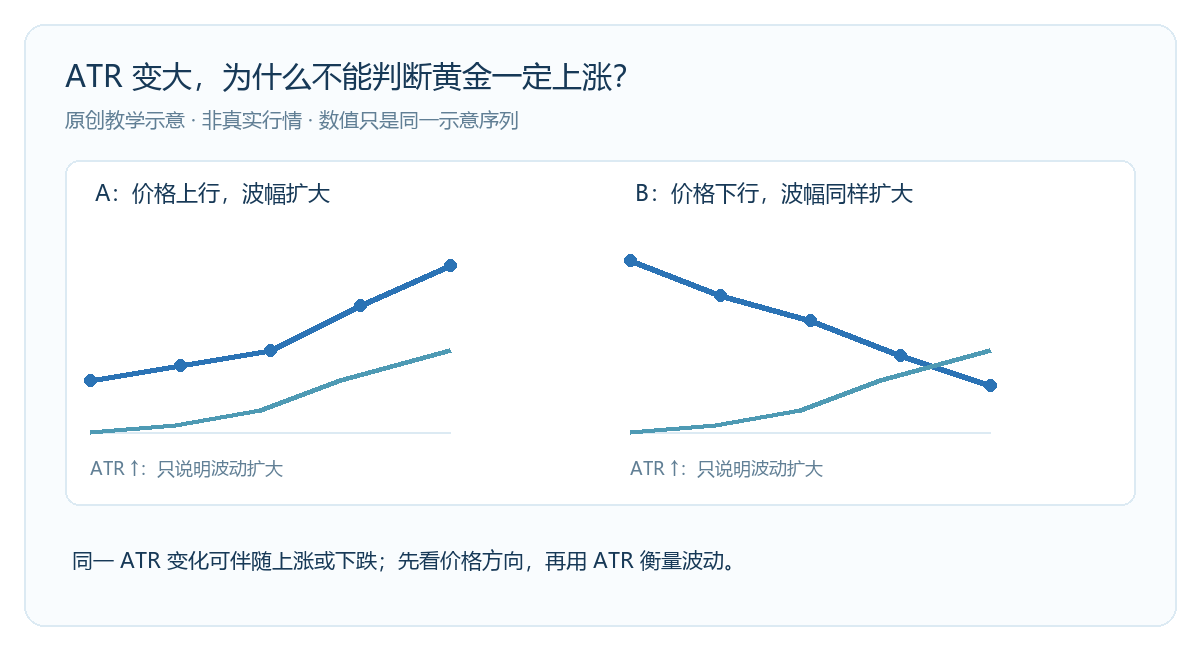
The ATR lines on both the left and right sides of the diagram are rising, but price on the left is moving up while price on the right is moving down. The lines were drawn by this article; they do not correspond to dates, real quotes, or historical win rates. What it illustrates is: volatility strength and direction need to be verified separately, and ATR is not an independent buy or sell signal.
How to Use Volatility to Arrange Observation Scope
ATR can help identify whether current volatility is greater than usual. Suppose a chart's ATR changes from an instructional value of 5 to 10; a fixed price distance of the same size is more easily covered by normal fluctuations in the new environment. When observing, you can re-examine "whether a stop-loss that is too close is merely falling within normal swings." But simply changing the stop-loss to 1.5 or 2 times ATR cannot guarantee avoiding stop-outs; a larger stop distance also means the potential loss for the same lot size increases, and this must be evaluated together with position sizing and execution slippage.
Cross-instrument comparisons require particular care. An asset with a higher quote price having a larger absolute ATR does not mean its relative volatility is necessarily higher; when comparing, at least unify the timeframe and quote units, and if necessary consider ATR as a proportion of price. Spot gold and XAUUSD quotes on different platforms may also differ in quote structure, trading sessions, and historical data.
Three Common Misuses and Failure Conditions
First, translating "ATR rising" into "bullish" while ignoring that declines also expand volatility. Second, seeing one large fluctuation and predicting the next bar will move in the same direction without evidence from a completed trend structure. Third, seeing the result first and then reverse-selecting timeframes and parameters so that every signal on the chart appears correct.
The failure conditions for the method in this article are: the data window is too short or contains abnormal gaps; platform switching makes TR sequences incomparable; the original price direction basis is overturned by completed candlesticks; and trading costs or leverage risk make the instructional volatility range impossible to convert into an actually bearable position. Study records should retain indicator parameters, screenshot times, the price structure at the time, and later counterexamples. ATR can only help quantify recent volatility; it does not guarantee predictions and does not replace stop-loss execution rules. Leveraged trading may cause substantial losses.

MT4 EA troubleshooting guides →