Can the ATR of gold on the 15-minute and 1-hour charts be compared directly? First unify the observation window
The same ATR parameter of 14 does not mean the same time span is covered. Use a teaching example to explain how the timeframe, smoothing method, and quote unit affect numerical comparisons.
Author: Thomas | Technical Analysis | November 11, 2026
Summary: The fact that the ATR on the 15-minute chart is smaller than on the 1-hour chart does not prove that short-timeframe conditions are safer, nor can it be used to conclude that the trend is weaker. ATR measures the average level of recent true range; before comparing, you must confirm the candlestick timeframe, calculation method, and price unit. This article only answers the question of whether ATR across different timeframes can be compared directly.
What does the 14 in ATR mean
Average True Range (ATR) is obtained by smoothing True Range (TR). TR takes the maximum of three values: the current high minus the current low, the absolute difference between the current high and the previous close, and the absolute difference between the current low and the previous close, so it can incorporate gaps between adjacent periods into the observation. This indicator was proposed by J. Welles Wilder. It measures the magnitude of volatility and does not provide upward or downward direction.
The parameter 14 usually refers to 14 candlesticks and does not automatically equal 14 days. On a daily chart it corresponds to 14 daily periods, while on a 15-minute chart it uses 15-minute candlesticks. Common Wilder smoothing retains a diminishing influence from earlier data, so "14 bars" describes the parameter length and does not mean that all prior information has completely disappeared. Different software may use other averaging methods, so the settings must be checked.
First look at the time covered by the two charts
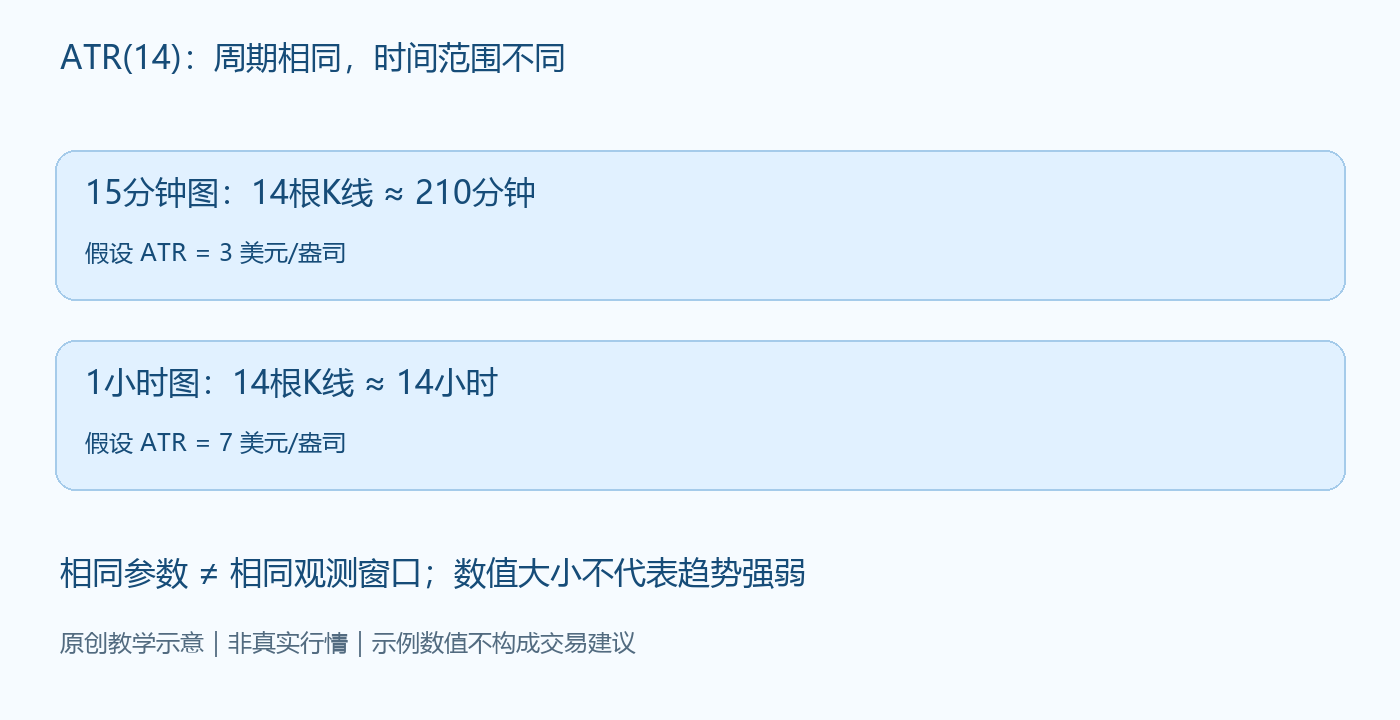
The chart assumes a 15-minute ATR of 3 USD per ounce and a 1-hour ATR of 7 USD per ounce; neither is real market data. The 14 candlesticks on the 15-minute chart nominally cover 210 minutes, while the 14 on the 1-hour chart nominally cover 14 hours; when there are market closures or missing candlesticks, the corresponding actual calendar span may also differ. The two values come from different windows, and 7 being greater than 3 cannot be directly interpreted as increased volatility within the same window.
Nor can you multiply the 15-minute ATR by 4 and treat it as the 1-hour ATR. High-low ranges and gaps are not added linearly, and rises and falls across multiple small periods may reverse each other. To compare the same time span, you should first fix the data source and start and end times, then recalculate using a consistent timeframe, rather than creating an indicator for another timeframe through multiple conversion.
How to make a reviewable comparison step by step
Step one: fix the same platform, same instrument, and same quote side, and record the chart server time zone. Step two: record the candlestick timeframe, ATR parameter, and smoothing method. Step three: prioritize using values from candlesticks that have already closed; a candlestick still forming will change its high and low, and the indicator will also update.
Step four: compare each timeframe's own historical distribution separately. For example, observe whether the 15-minute ATR has risen relative to its own records over a past period on the same timeframe, then separately check the 1-hour chart. If you need to express it as a percentage, you can use ATR divided by the corresponding price and then multiplied by 100%, but scaling only adjusts the price scale and cannot eliminate the problem of different observation times.
Finally, put indicator changes back into the price structure: when the range expands, it may be trend continuation, or it may be violent back-and-forth movement within a range. You must separately look at highs and lows, closing positions, and whether price continues to leave the original range; ATR must not replace directional judgment.
Common misjudgments and failure conditions
The most common mistake is to understand a lower ATR as meaning that stop-losses can be reduced indefinitely, or to regard a higher ATR as a reason to chase rises. An average is a summary of past information; sudden news, gaps, and liquidity changes can all make the next candlestick far exceed the recent average. Even if ATR multiples are used to arrange observation distance, structural position, spread, slippage, and the account loss budget also need to be considered.
If two platforms have different historical data, trading sessions, or smoothing methods, the difference cannot all be attributed to market changes. Stale quotes, samples that have just started loading, or abnormal spikes will also reduce the value of the comparison. In these cases, first verify the inputs and temporarily refrain from drawing conclusions from the indicator.
The method in this article is used to unify the basis for comparison and cannot guarantee future volatility or trading results. Only when you can clearly write down "which timeframe, what parameters, and what time the values are from" is there a basis for discussing whether a change is meaningful.

MT4 EA troubleshooting guides →