How Is Gold ATR Used to Judge Stop-Loss Distance? Look at Structure First, Then Calculate Position Size
ATR only measures historical volatility; it does not predict direction. Use a three-step check of the structural invalidation point, ATR, and risk budget to assess gold stop-loss distance, and avoid mechanically applying multiples.
Author: Thomas | Technical Analysis | October 28, 2026
ATR often appears in gold traders' stop-loss settings. Some see an ATR of 10 and mechanically set the stop-loss at 10 dollars; others see ATR rising and conclude that the market will rise. Both uses ignore its original meaning: ATR describes the average range of each candlestick over a past period; it does not predict price direction, nor does it decide for you how much loss you can bear.
What ATR Is Actually Calculating
ATR is Average True Range. The "true range" of a single candlestick takes the largest of three numbers: the current high minus the low, the distance between the high and the previous close, and the distance between the low and the previous close. The latter two bring gaps into the calculation. Smoothing the true range over a period gives ATR; the common default parameter is 14 candlesticks. Daily ATR and one-hour ATR measure different time scales and cannot be directly mixed.
ATR's unit is consistent with the chart price. If XAUUSD is displayed in dollars per ounce, the ATR value is also the price distance in that quote, not points, lots, or account dollar profit and loss. Different brokers' quotes and candlestick cutoff times may differ, so readings may also differ slightly. Before comparing, first determine the instrument, timeframe, parameters, quote decimal places, and platform.
How to Use ATR in Stop-Loss Discussion
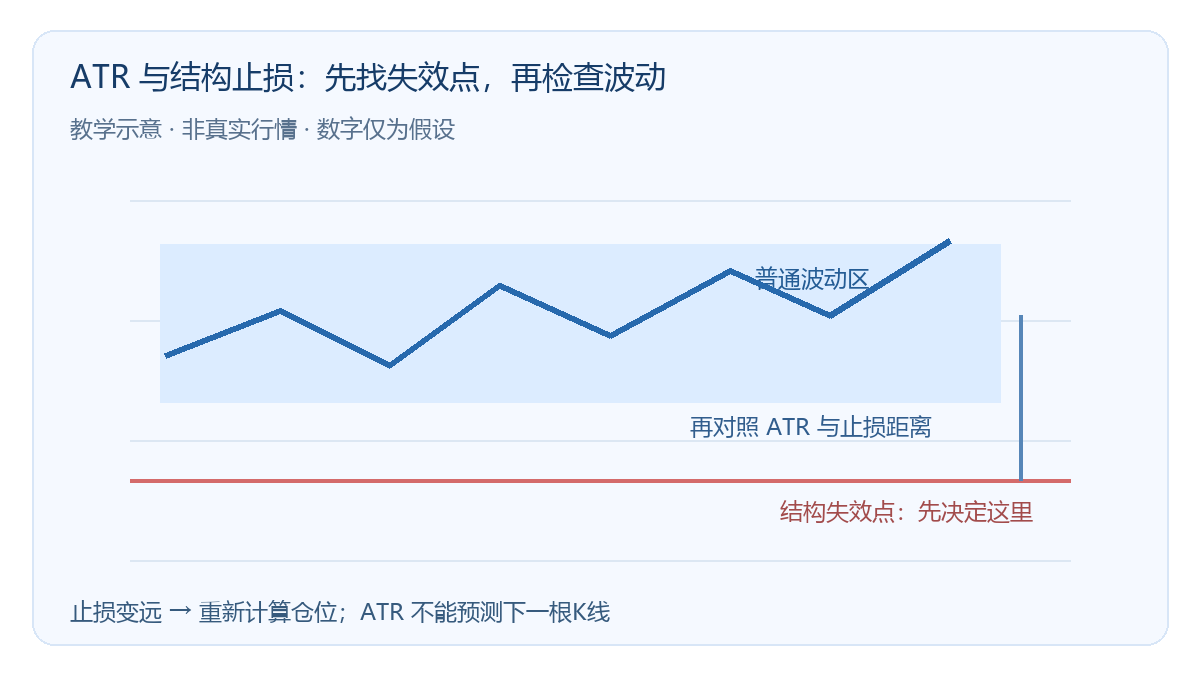
Step one: first identify the invalidation location based on the trading idea. For example, if a long hypothesis depends on a certain prior low not being broken, then the structural change after a break is the main basis. Step two: check the ATR on the same timeframe to judge whether this invalidation location is too close to ordinary fluctuations; if only a very small distance away, normal noise may trigger the stop-loss. Step three: calculate position size based on the actual stop-loss distance, contract specifications, and tolerable loss. When the stop-loss is farther away, position size should be reassessed; you cannot merely widen the stop-loss while keeping the original lot size.
The numbers in the figure are teaching illustrations, not real market data: suppose a certain segment of candlesticks has a typical fluctuation of about 8 to 12 quote units per candle, while the distance from entry to the structural invalidation point is only 2 units; then even if the direction judgment later proves correct, it is easy to be swept out first by ordinary fluctuations. Conversely, mechanically setting the stop-loss at "2 times ATR" is not necessarily reasonable either: it may fall inside the structure, or it may exceed the account risk limit. ATR is only a ruler for checking distance; structure and risk budget determine whether the plan holds.
Common Misreadings and Failure Conditions
Rising ATR only indicates expanding volatility; both large price rises and large price falls can cause it to rise. Around news releases, the start of the week, or when liquidity is thin, spreads and slippage may widen; ATR is based on historical candlesticks and cannot guarantee that the next candle's range will not exceed the reading. Sudden price jumps may also cause the actual execution price to deviate from the preset stop-loss.
Another mistake is treating ATR from different timeframes as the same ruler. Entering on a one-hour chart but using daily ATR to infer that "fluctuation certainly will not be this large within one hour" has no logical basis. Changing the parameter from 14 to a shorter period makes the reading more sensitive and more easily affected by a single abnormal fluctuation; after changing the parameter, past thresholds cannot be copied unchanged.
A Practical Checklist
Record the instrument and platform, chart timeframe, ATR parameter, structural invalidation point, distance from entry to stop-loss, estimated spread, and maximum tolerable loss. Then ask: if the next candle's range is larger than the recent average, can the account still bear it? If the answer is no, reduce position size or abandon the trade, rather than letting ATR promise for you where price will stop. ATR helps measure historical volatility; it cannot guarantee that the stop-loss will be effective or that the trade will be profitable.

MT4 EA troubleshooting guides →