Does a Rising ATR Mean You Should Go Long Gold? Illustrating the Difference Between Volatility Magnitude and Direction
Using two sets of original educational data to explain True Range (TR) and ATR, illustrating gaps, smoothing windows, and the boundaries of direction judgment, and checking common invalid usages.
Author: Thomas | Technical Analysis | October 18, 2026
When some people see ATR rising, they interpret it as strengthening upward momentum; when they see ATR falling, they treat it as risk having disappeared. Both interpretations overstep what the indicator itself can answer. ATR describes the volatility magnitude of a period of historical prices; viewed alone, it cannot determine whether the next candlestick will go up or down.
Start with True Range (TR)
The True Range of one period requires comparing three distances: the current period's high minus low, the absolute value of the high minus the previous period's close, and the absolute value of the low minus the previous close, taking the maximum among them. Including the previous close is meant to bring cross-period price gaps into observation.
Below is an original educational illustration, all using arbitrary units, with no real dates, volume, or gold market data. The chart shows single-period TR and cannot be directly called an ATR that has already been calculated.
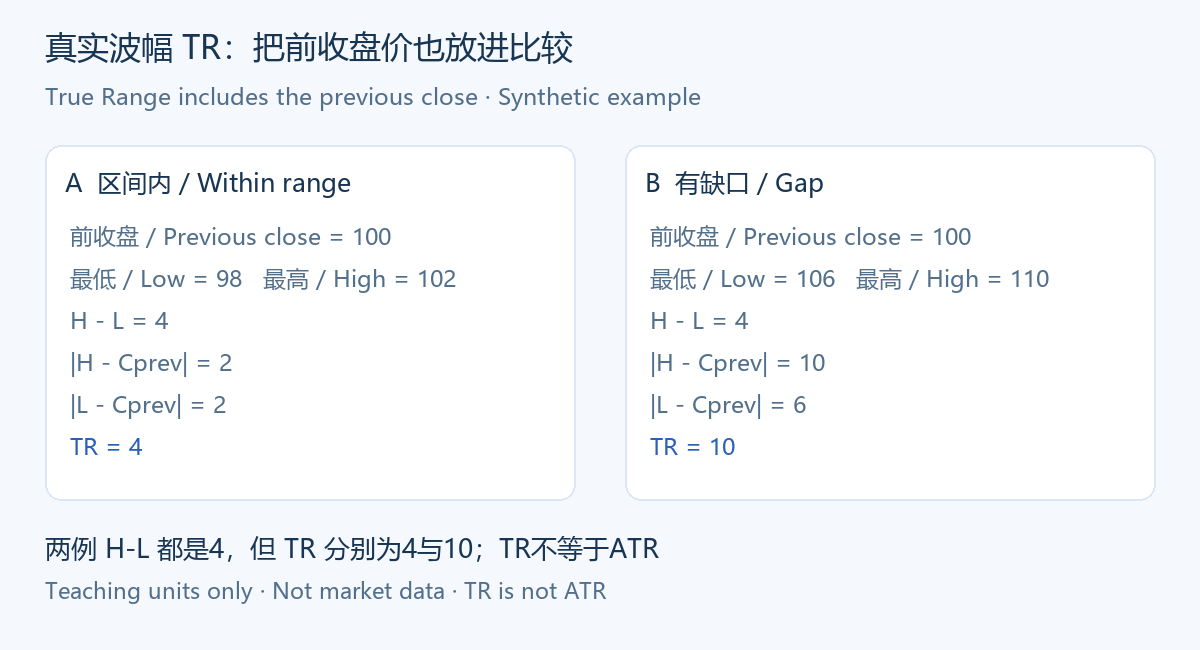
Same four units—why are the results different?
In Example A, the previous close is 100, the low is 98, and the high is 102. The three distances are 4, 2, and 2, so TR equals 4. In Example B, the previous close is also 100, but the low is 106 and the high is 110; the three distances become 4, 10, and 6, so TR equals 10.
The high-low range within both periods is 4, yet their cross-period positions differ. This comparison shows that looking only at the distance between the current high and low will miss another part of the change. The examples do not provide the full path of opens and closes, so they cannot be used to judge which price action is more suitable for trading.
ATR adds a time window
ATR averages or smooths TR over multiple periods. A common Wilder update method is: the previous ATR multiplied by the period count minus one, plus the current TR, finally divided by the period count. In actual use, one must also verify the platform's initialization method, period settings, and historical data.
For example, suppose the previous ATR for a 14-period setting is 4 and the current TR is 10; the new value is 62 divided by 14, approximately 4.43. It is not 10, nor does it predict that the next period will necessarily fluctuate by 4.43. This remains an independent arithmetic example and does not come from any live trading or backtest results on the website.
The most easily invalid usage: substituting volatility for direction
Sharp price rises and sharp price falls can both be accompanied by a larger True Range. Therefore, going long solely because ATR has risen lacks a directional basis; and concluding that large fluctuations will not occur solely because ATR has fallen also mistakes a historical description for a future guarantee. Answers the indicator does not provide cannot be supplied through more eye-catching colors or shorter periods.
If ATR is used as a research variable, one should separately record where the direction judgment comes from and where the volatility judgment comes from. When the directional evidence fails, a still-high ATR cannot defend the original view. Likewise, if price is still moving in the original direction, it does not mean that expanded volatility can be ignored.
Unify the basis before using it for risk comparison
To compare two segments of ATR, first fix the instrument, period, and parameters. Values on a five-minute chart and a daily chart are not on the same time scale; different quote sources and gap handling may also affect the results. If settings are switched, keep a record of the changes to avoid using numbers under different bases to explain the same change.
Using ATR multiples for distance estimation does not automatically produce a reasonable position size. Contract units, costs, tolerable loss, and actual execution conditions also need to be considered. In particular, one must not expand only the exit range to accommodate a wider distance without rechecking account risk at all. This article does not recommend a fixed multiple suitable for everyone.
Check only one hypothesis per review
One can first save the price records and ATR readings under the original parameters, then write down what one expects it to help identify. Subsequently, keep both valid and invalid examples and check whether one is only cherry-picking after the fact. Do not keep changing windows whenever results are unsatisfactory, ultimately showing only the most pleasing set of parameters.
The charts and numbers in this article only explain calculation boundaries and do not provide real-time levels or definitive buy and sell signals. ATR can help describe historical volatility, but it cannot predict a definite direction, eliminate gap risk, or guarantee execution prices; leveraged trading may cause substantial losses.

MT4 EA troubleshooting guides →