Is the Third Wave of Elliott Wave Theory Always the Longest? Check the Count with the Length Rule
The third wave cannot be the shortest, which does not mean it must be the longest. Use original illustrative diagrams to understand price length, candidate counts, and invalidation conditions.
Author: Thomas | Technical Analysis Tutorial | November 5, 2026
Summary: Elliott Wave Theory is often simplified to "the third wave is always the longest," which leads to incorrect counts. The classic rule requires that the third wave cannot be the shortest of the first, third, and fifth waves; it does not require it to always be the longest. This article only addresses how to verify this length rule, using hypothetical units for illustration. It does not involve today's gold price levels, nor does it treat wave counts as certain predictions.
What Is Compared Is Price Length
The Elliott Wave framework distinguishes five-wave structures developing in the main direction from corrective structures. Here we discuss the first, third, and fifth segments within an impulse structure at the same degree, comparing the price distance between start and end points, not duration, number of candles, or slope on the chart. The third segment being drawn steeply and moving quickly does not by itself prove that it is the longest in price. Different axis scaling can also change the visual impression, so endpoints should be recorded first and then calculated.
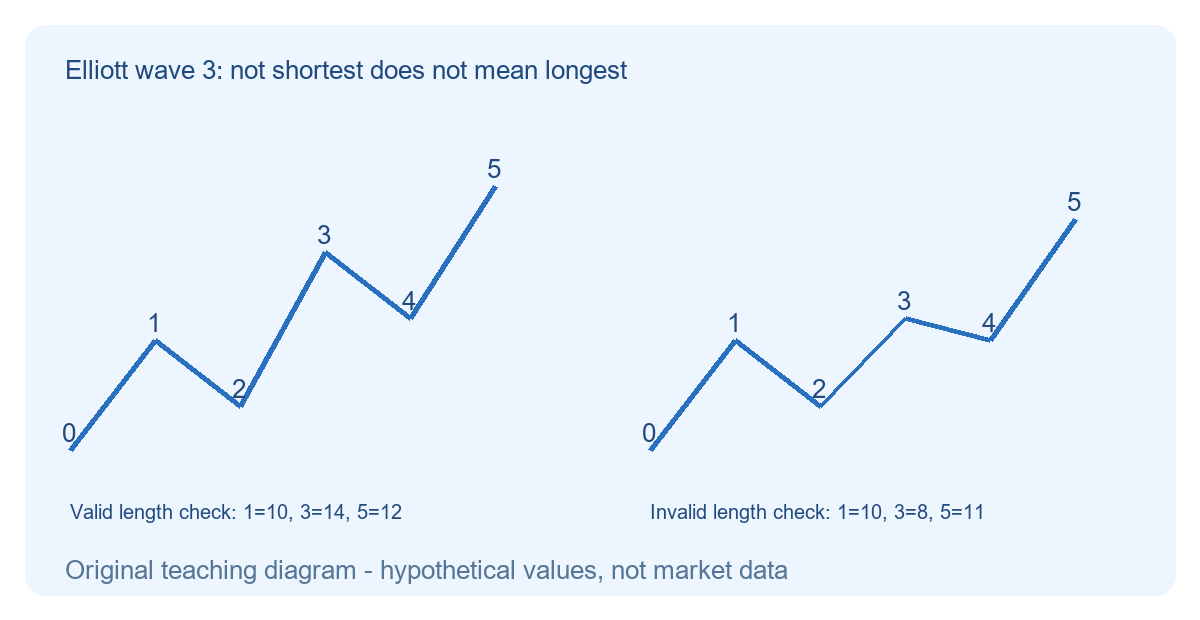
In the left diagram, the first segment runs from 0 to 10, length 10; the third segment runs from 4 to 18, length 14; the fifth segment runs from 12 to 24, length 12. The third segment is the longest in this example, but that is not the only result the rule requires. If the first segment has length 10, the third has length 12, and the fifth has length 15, the third is not the longest but is still not the shortest of the three. This only means it passes this one length check; it cannot be used to prove that the entire labeling is valid.
Check the Count in Four Steps
Step one: fix the chart timeframe, price basis, and wave degree; do not directly compare a segment on the hourly chart with a segment on the daily chart. Step two: record the start and end points for the first, third, and fifth segments respectively, and calculate the absolute price difference. Step three: check whether the third segment is shorter than both of the other two. In the right diagram, the first segment is 10, the third is 8, and the fifth is 11; the third is the shortest, so this candidate labeling does not satisfy the above classic constraint. Step four: go back and check other structural conditions, especially retracement position, internal subdivision, and whether alternative labels exist.
If the third segment is already shorter than the first, then in this labeling the fifth segment cannot be longer than the third; otherwise the third would become the shortest. What is obtained here is a constraint on the candidate count; it cannot be reversed to claim that the market must stop at a certain price. If price continues to extend and violates the constraint, the count should be withdrawn or reassessed, rather than requiring the market to obey the numbers on the chart.
Keep Alternatives While the Structure Is Incomplete
In actual market conditions, the fifth segment may not yet be complete, and the interior of the third segment may still be extending. The choice of start and end points therefore carries uncertainty. A reasonable approach is to save the primary scenario, alternative scenarios, and the conditions under which each would be invalidated at the time, and to record why adjustments were made; if labels are redrawn after every price change without preserving previous judgments, it becomes difficult to assess whether the method is useful.
Different analysts may identify wave degree, extended waves, and corrective structures differently. Structures such as diagonal triangles also involve specific rules, and all patterns cannot be applied based on a single ordinary impulse wave illustration. This article only checks the length condition and does not claim to provide complete counting standards.
Common Misreadings and Boundaries of Use
Treating "the third wave is often strong" as "the third wave must be the longest" upgrades an empirical tendency into a hard conclusion; treating passing one rule as confirmation of a trend skips other evidence. Wave labeling is better suited to organizing candidate paths and still requires price structure and clear invalidation conditions. Gold news events, price gaps, and widening spreads can also affect execution; even if the candidate count holds, trading may still result in losses. First limit the risk you can bear, then consider whether to use this analytical tool.

MT4 EA troubleshooting guides →