Elliott Wave Theory Basics: How to Count Five Waves and Three Waves, and How to Fix a Miscount
Use original diagrams to explain five-wave impulses, three-wave corrections, and three common impulse wave constraints, and teach you to save alternative counts and invalidation conditions.
Author: Thomas | Technical Analysis Tutorial | October 19, 2026
"Which wave is gold in now?" This question easily leads people to form an answer first and then pick turning points on the chart to fit it. Wave theory is suitable for organizing the possible structure of a market move, but it does not guarantee that everyone can count the same set of waves in real time. This article only covers the most basic five waves and three waves, how to first fix the observation scale, and what kind of evidence would overturn the original count.
What Five Waves and Three Waves Mean
The basic Elliott Wave model describes the impulse phase along a larger-degree trend as five subwaves 1, 2, 3, 4, 5, and the subsequent correction phase against that trend as three subwaves A, B, C. The "trend" here must specify a time degree: the same stretch of price action may be only a subwave in a larger daily structure, while on a smaller timeframe it can be broken down into multiple swings.
The model is an identification framework, not a promise that price must complete eight neat segments. Correction structures can also be more complex, and live charts often allow multiple valid subdivisions. Seeing price rise three times in a row and directly labeling them 1, 3, 5 while ignoring the intervening pullbacks, degree, and rules treats labels as evidence.
Fix Three Things Before You Start
First, fix the instrument, quote source, and observation timeframe, for example always using the four-hour chart on the same platform. Second, state from which visible starting point the count begins, and save a screenshot or data from that time. Third, write down the alternative count first: if the current rise is actually only an A-B-C rebound, what structure would you need to see before abandoning the "five-wave impulse" judgment?
Fixing these conditions is meant to prevent constantly moving the starting point after the market has moved. Historical charts make it easiest to find beautiful five-wave counts; what is truly valuable is being able to record your uncertainty when the turning point has not yet been confirmed.
First Use Three Constraints to Rule Out Wrong Labeling
Under the standard definition of an impulse wave, wave 2 cannot cross the starting point of wave 1; wave 3 cannot be the shortest of the three impulse subwaves 1, 3, and 5; and wave 4 in a standard impulse cannot enter the price range of wave 1. If the chosen count violates these constraints, the scenario should first be withdrawn rather than secretly changing the turning points. Different wave types and special structures have their own definitions, and these three rules cannot be mechanically applied to all corrective waves.
For example, suppose a hypothetical structure rises from starting point A to B and calls it wave 1, then falls back to C and calls it wave 2. If C is already below A, then under this impulse scenario it can no longer continue to be called wave 2. This judgment does not require predicting later rises or falls; it is enough to first identify whether the scenario is internally consistent.
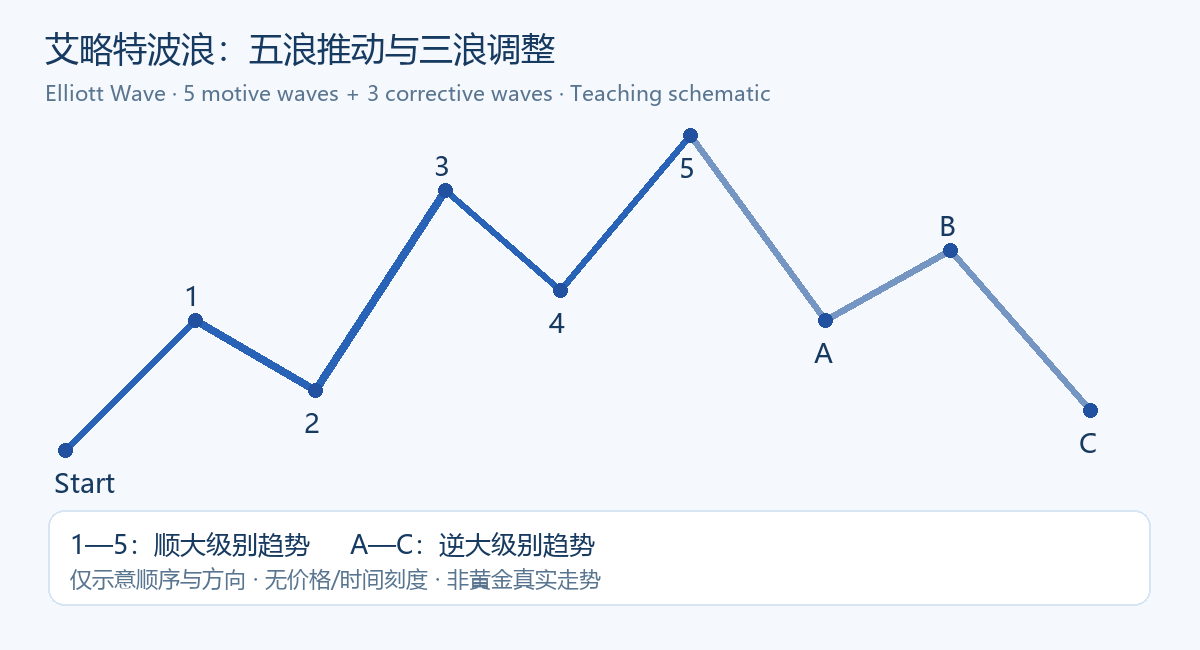
The chart above only illustrates label order and direction; the polylines have no real time or price scale. The length of the line segments does not represent historical gold volatility, nor can target prices be derived from them.
What to Do When Two Counts Coexist
If the chart can be explained both as an unfinished wave 5 and as a wave B within a correction, do not force yourself to choose a single answer. Write the two scenarios as conditional statements: what changes support the current scenario, what changes invalidate it, and which alternative explanation to use after invalidation. Waiting for new information is more important than ignoring contrary evidence in order to complete the labels.
Be cautious when using Fibonacci ratios as auxiliary comparisons. Common ratios are not mandatory rules, and you cannot skip turning-point confirmation, structural constraints, and actual trading costs just because a pullback is close to a ratio. The subjectivity of wave counting is especially evident in the choice of starting point and degree switching.
Common Mistake: Counting Every Segment Correctly in Hindsight
New data keeps appearing on the right side of the chart, and what was originally labeled wave 4 may become part of a larger-degree correction. When reviewing, keep the old chart, old time, and old judgment, and record why the count was changed; do not show only the version that matches perfectly after revision. When comparing the quality of counts, look at whether the conditions written down in advance appeared and whether invalidation was acknowledged in time, not at whether a complete eight-wave pattern can be drawn in the end.
For gold in particular, pay attention to differences in quotes and trading sessions between spot and futures on different platforms. If the turning points themselves change because of a change in data source, the wave labels also need to be rechecked. This article is method teaching and does not contain the current XAUUSD wave count, entry or exit points, or return promises; leveraged trading may cause substantial losses.

MT4 EA troubleshooting guides →