How to Identify an ABC Correction in Gold Wave Theory? Draw the Path First, Then Keep Alternative Counts
Use an original light-blue educational diagram to explain the basic path of an ABC correction, the 5-3-5 subdivision of a zigzag, alternative counts, and invalidation conditions, so as to avoid forcing wave counts after the fact.
Author: Thomas | Technical Analysis | October 31, 2026
Readers searching for "how to count a gold ABC correction" often see a chart with A, B, and C already drawn. The real difficulty is not labeling three price swings with letters after the fact, but judging while the market is still developing which structures are confirmed and which may still change. Elliott Wave Theory provides a way to describe market rhythm, not a formula that can lock in turning prices in advance.
What ABC Is: Don't Call Every Pullback a C Wave First
In the common framework of wave theory, impulses in the direction of the larger-degree trend and corrections against the trend are discussed separately. If the larger-degree direction is upward, a pullback may be labeled wave A, the rebound after the decline wave B, and a subsequent decline may become wave C. Elliott Wave International's explanation of zigzag corrections states that a single zigzag is labeled A-B-C and is often described internally as 5-3-5. Here the 5 and 3 are smaller-degree wave subdivisions; they do not require every reader to see exactly the same number of candlesticks with the naked eye.
Different correction patterns may also contain ABC labels, so one cannot conclude that a pattern is a standard zigzag based only on its three-part appearance. The structure and boundaries of flat, triangle, and combination patterns may differ. When analyzing, first state which labeling convention is being used, then record the starting point, each turning point, and the time frame used. Otherwise, by changing the time frame or ignoring one small fluctuation, the same price swing can be drawn with multiple seemingly reasonable counts.
One Diagram Showing the Path and the Unknown Part
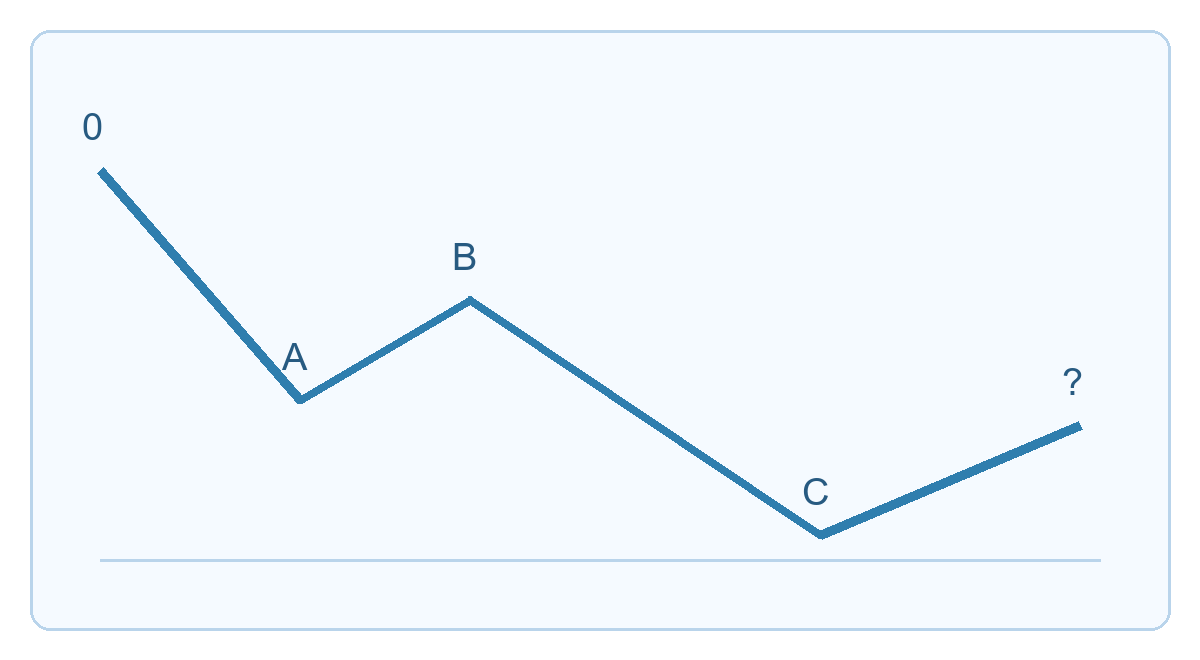
In the diagram, 0 to A represents the first decline, A to B represents the intermediate rebound, and B to C represents another decline; the question mark at the end reminds readers that whether C has ended and whether what follows is a new trend or a more complex correction was undetermined at the time. This white-and-light-blue diagram is purely an educational illustration; the vertical axis has no real U.S. dollar prices, and it is neither a historical gold screenshot nor a representation of specific entry or exit levels.
When practicing with the diagram, first circle the larger-degree original trend, then mark the start and end of A on the same time frame. After seeing the rebound, temporarily write only "possible B"; do not immediately declare C complete just because price has fallen again. Wait for the decline to form an identifiable low and for subsequent price confirmation, then test whether internal requirements such as 5-3-5 can actually be satisfied. If the evidence is insufficient, keep the label "not yet confirmed."
Alternative Counts Must Be Written Down at the Same Time
The first interpretation may be an A-B-C zigzag; the second may be a local segment within a more complex correction, or even just a mid-trend pullback within a larger trend. The invalidation conditions for each count should be written separately. For example, if the so-called B-wave rebound crosses the boundary allowed by the convention being used, the original zigzag interpretation needs to be redrawn; if the so-called C wave is followed by another extension in the same direction, the premature judgment that C has ended should also be withdrawn. Specific boundaries should be explained according to the rules of the wave school being used and must not be modified on the spot to protect a view.
The biggest risk in wave counting is after-the-fact explanation: by choosing the starting point after price has moved, one can almost always draw a nice-looking A, B, and C. To reduce this bias, save timestamped original counts and alternative counts while the market is developing, then review one by one later which ones were falsified. Do not show only the successful charts.
Applicable Conditions and Risks
The wave framework is better suited to helping organize price structure across multiple degrees than to deciding trades on its own. In gold, wave boundaries may change quickly during news, sudden liquidity shifts, or weekend opening gaps; different platform quotes can also cause differences in turning points. Especially within a ranging market, forcibly dividing A, B, and C can easily ignore the fact that price has not yet left the range. First use a clear chart time frame and risk budget, then judge whether the count has educational value. This article is for technical education only, does not constitute trading advice, and does not promise forecasts or returns.

MT4 EA troubleshooting guides →