Why Can't You See the Donchian Channel Breakout? First Check Whether the Current Candlestick Is Included
The current candlestick may simultaneously change the channel boundaries. Use a teaching formula to distinguish the old upper band, the new upper band, and the closing breakout, and avoid mixing different calculation windows.
Author: Thomas | Technical Analysis | November 14, 2026
Summary: The price clearly makes a recent new high, yet the channel line rises along with it, so it seems there is never a breakout. This is not necessarily an indicator failure; it may be that the current candlestick has also been included in the comparison boundary. This article only answers how to verify the calculation window for a Donchian Channel breakout, and does not provide current market price levels or fixed trading instructions.
What Are the Boundaries of the Donchian Channel
The Donchian Channel was proposed by Richard Donchian. The common upper band takes the highest price among a selected number of bars, the lower band takes the lowest price, and the middle line is the average of the two. A parameter of 20 means 20 candlesticks, and only on a daily chart does it correspond to 20 daily candlesticks. It is different from a manually drawn parallel trend channel, and it is not a Bollinger Band composed of a moving average and standard deviation.
Whether a charting tool includes the current candlestick and whether it sets a drawing offset will change the boundaries you see. Some implementations directly exclude the current candlestick, while others include it in real time. Therefore, you cannot assume that all platforms use exactly the same algorithm just because you see the same parameter; you should first read the indicator documentation.
Why Does a New High Push the Upper Band Up Along With It
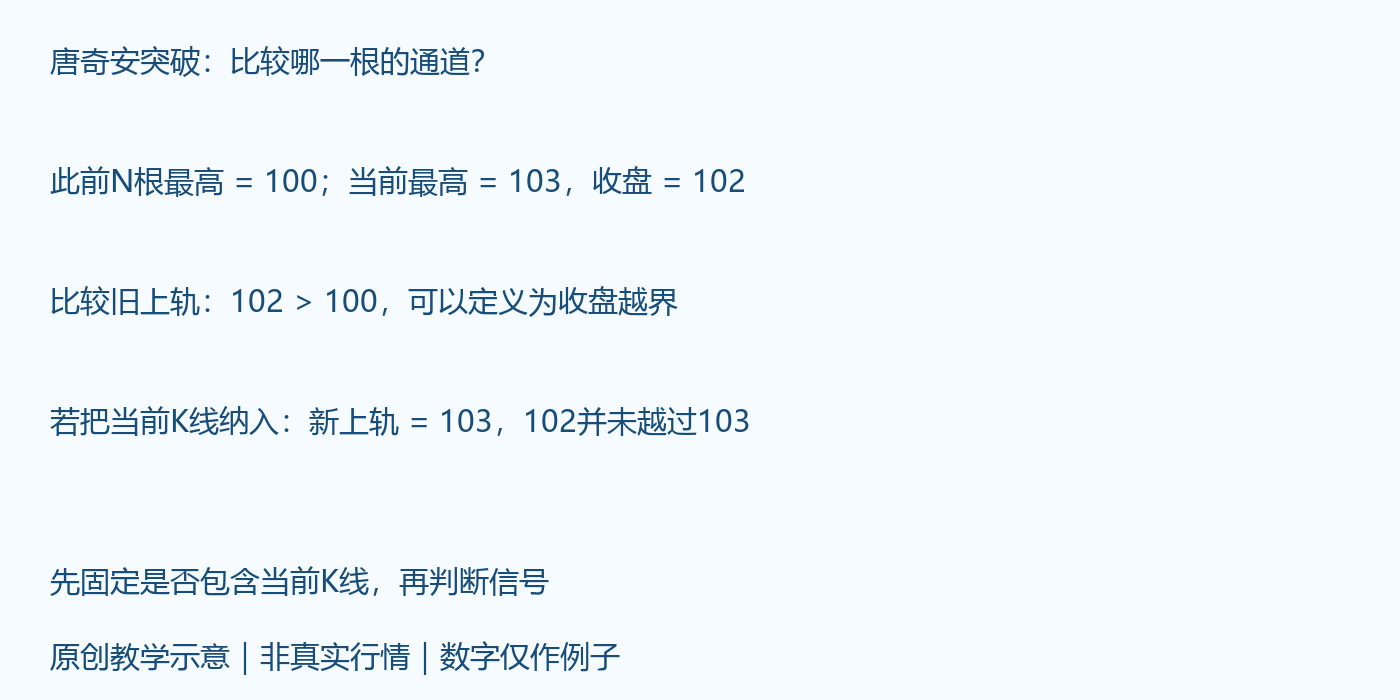
The figure assumes that the highest price of the previous N candlesticks was 100, and the current candlestick has a high of 103 and a close of 102; all are teaching data, not real market data. If comparing with the upper band of the previous window, 102 is above 100, and the close can be deemed to have crossed the old boundary according to a pre-agreed rule; if the current candlestick is also included, the new upper band becomes 103, and 102 is naturally not above 103.
In a channel that uses the highest price, the current close will not be above the new upper band that includes its own high. This is a calculation relationship; it does not mean the market has never made a new high. Therefore, it must be clear whether "breakout" refers to the previous boundary or to some drawing line that has already shifted; these cannot be conflated into one question.
How to Verify Step by Step
Step one: fix the instrument, candlestick timeframe, parameter length, and price data source. Step two: check whether the indicator includes the current candlestick, and whether the drawing offset only changes the display position. A display shift does not necessarily mean the calculation window changes in the same way; visual position cannot replace the algorithm documentation.
Step three: before a new candlestick begins, record the highest and lowest prices of the previous N completed candlesticks, then compare them separately with the current candlestick. The TradingView Channel BreakOut strategy description uses the current high crossing above the previous bar's channel upper band as its long condition; this is a specific strategy definition and does not mean all methods must use a high-price trigger.
Step four: distinguish between intraday crossing and closing crossing. If the current high exceeds the old upper band but the close falls back below it, the intraday rule may be satisfied, but the closing rule is not. The timeliness, failure scenarios, and execution results of the two rules differ, and they must be determined before observation; you cannot switch after seeing the result.
An Example That Is Easy to Misread
Continuing with the assumption in the figure, if the high is 103 but the close becomes 99, the intraday price is indeed above the old upper band of 100, but no closing confirmation is formed. If the original plan required closing confirmation, you cannot claim the rule has been triggered just because the wick has crossed. If the original rule used an intraday trigger, the later pullback result should also be retained truthfully.
Conversely, a close at 102 does not guarantee that the next candlestick will continue rising. A channel breakout only indicates that a new position has appeared relative to the selected window, and price may still return to the old range afterward. If price falls back into the old boundary and repeatedly fails to recover it, the original assumption of upward continuation needs to be reassessed.
Common Mistakes and Ineffective Environments
Moving daily parameters to a 15-minute chart while calling it the same time length; comparing a channel that includes the current candlestick with a script that excludes it; or treating touching the boundary and exceeding the boundary as exactly the same will all create signal differences. Missing historical data, instrument suffixes, and differences in trading sessions may also change the highest and lowest values.
In a range, price may frequently refresh the boundaries of a short window, causing repeated crossings. Enlarging the parameter may reduce some noise, but it may also delay the response; you cannot claim that a certain parameter is optimal for all market conditions. Sudden gaps can also make actual fills far from the observed boundary, and indicators cannot guarantee execution prices.
From Calculation Checks Back to Risk Budgeting
First unify the window and rules, then discuss whether a signal has occurred, and only then evaluate risk. When the calculation basis is not determined, you should not test guesses by adding to positions. Even if the algorithm is completely correct, it does not mean the strategy already has a basis for positive returns; costs, slippage, samples, and applicable environments still need to be checked independently.
The numbers in this article only help understand the old and new boundaries and do not constitute a gold price forecast. Any breakout rule has a possibility of failure; exit conditions and affordable losses should be written clearly in advance, rather than constantly modifying the window when price moves unfavorably.

MT4 EA troubleshooting guides →