Why does it fall back after a breakout? Diagrams show confirmation and failed recovery
Compare the two light-colored teaching diagrams A and B to distinguish a brief cross from sustained holding, and write out the area basis and invalidation conditions in advance.
Author: Thomas | Technical Analysis | October 12, 2026
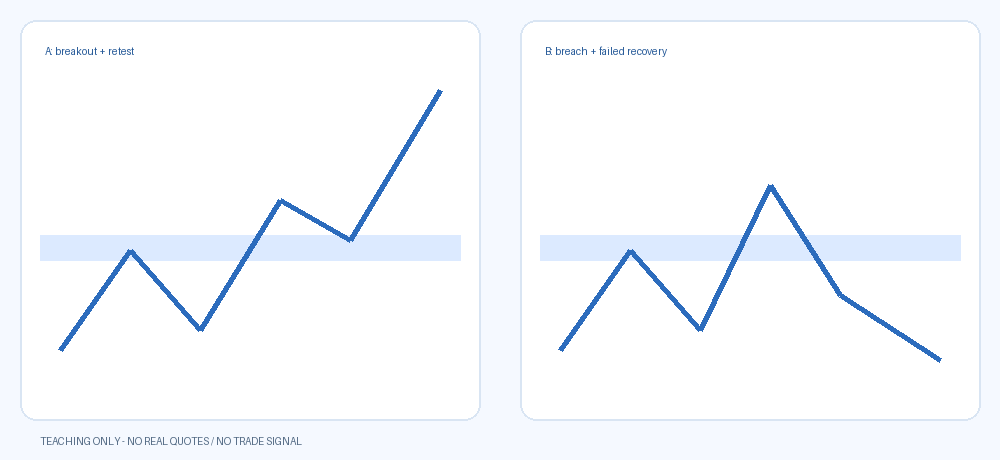
Price crossing a horizontal line does not mean a valid breakout has been established. Confirmation requires a method specified in advance: which area to observe, what timeframe to use, what state counts as holding, and under what circumstances the original hypothesis is invalidated. This article includes two light-colored teaching diagrams, A and B. The lines are not actual market data and do not provide today's gold price levels.
Turn the horizontal line into an explainable area
First write clearly where the observation area comes from, such as historical highs and lows under the same criteria or price structure. Without complete information, do not call a casually drawn line a verified support or resistance. The width of the area also must not be constantly changed just to fit later results.
Different quote sources, bid/ask sides, and timeframes may give different positions. Fix these conditions before analysis, then discuss whether price has crossed; otherwise a single label change may be mistaken for a new signal.
Diagram A: After crossing, the retest still holds
Diagram A illustrates a line crossing the light blue area, with the retest not persistently falling back inside the area, followed by an upward recovery. It explains one observation path for breakout continuation, but does not mean this path will necessarily appear or guarantee profit.
What counts as sustained holding must first be determined: for example, what timeframe is used, and whether closing price or another confirmation method is used. This article does not set universal parameters suitable for everyone, nor does it equate a single wick with completed confirmation.
Diagram B: Brief cross, then failed recovery
Diagram B illustrates price crossing the area and then falling back, afterward being unable to recover and continuing downward. It shows one path in which the original continuation hypothesis needs to be reexamined. A brief cross and sustained holding are different states.
Neither diagram has real prices or time scales, so entry, stop-loss, or targets cannot be calculated from them. A and B are only used to compare processes, not as live screenshots of successful and failed trades.
Don't wait for the result before changing confirmation standards
If one timeframe was originally used, and after price falls back it is temporarily switched to a shorter timeframe to prove the judgment correct, the conclusion becomes difficult to test. Keep the first standard, the time of modification, and the reason, and explain that it is new research rather than the original prediction succeeding.
Likewise, do not keep expanding the range every time the area is crossed, until finally any price movement fits expectations. Revisions can occur, but a record must be kept of when the original hypothesis was invalidated.
Invalidation conditions, separate from trade execution
One observation framework is: after crossing, if price persistently falls back below the area and subsequent rebounds cannot hold above it again, the continuation hypothesis is invalidated. This is a research condition, not a stop-loss instruction guaranteeing execution for a specific account.
Actual execution is still affected by spreads, gaps, and platform rules. The observation area does not directly represent the risk amount, and order status cannot be judged from a one-sided chart alone. When information is lacking, keep the unknown unknown, and do not fabricate the actual execution process.
Keep samples that did not hold
In review, besides successful continuations, also preserve records of brief crosses, incomplete retests, and insufficient evidence. Showing only Diagram A-style results will make the method appear more certain than it actually is. Without complete samples and cost statistics, do not publish a fixed win rate.
Do not treat multiple tools using the same price as completely independent evidence. Overlapping tools can help organize observations, but do not automatically prove that an area is more reliable.
Next steps after reading the diagrams
In real market conditions, recheck the source, time, and timeframe, then record the area basis, confirmation method, invalidation conditions, and subsequent results. If market conditions change, note the update time, and do not mechanically transfer teaching diagrams to actual orders.
This article does not fabricate live trading experience or profit results. Leveraged trading may cause major losses. The content is for technical research and education and does not constitute a buy or sell instruction. The diagrams are teaching illustrations and cannot predict future prices.
MT4 EA troubleshooting guides →