Does gold necessarily rise after a Bollinger Band squeeze? First distinguish volatility from direction
A Bollinger Band squeeze reflects recent volatility contraction and does not indicate in advance the breakout direction for gold. Diagrams are used to explain bandwidth, price confirmation, false breakouts and invalidation conditions.
Author: Thomas | Technical Analysis Tutorial | October 26, 2026
Many chart tutorials draw a Bollinger Band squeeze as an arrow ready to launch, then directly predict that 'gold is about to rise.' This inference skips a key step: a squeeze describes recent price volatility narrowing; it does not tell us whether the next move will be up or down. This article answers only one search question: when you see an XAUUSD Bollinger Band squeeze, how should you record it, wait, and identify errors? The images are original teaching illustrations, not real market data or trading records.
What a Bollinger Band squeeze actually measures
A common Bollinger Band uses a moving average over a period as the middle band, with the upper and lower bands expanding according to the standard deviation of prices over that period. Charting software usually provides default settings of a 20-period moving average and two standard deviations above and below, but both the period and the multiplier can be changed. A smaller distance between the upper and lower bands usually indicates that price dispersion within the observation window has decreased. To compare whether the bands are 'narrow,' keep the same instrument, timeframe and parameters fixed, and compare the current bandwidth with that instrument's own historical bandwidth; do not directly compare the absolute bandwidth of one-hour gold with that of daily gold.
A squeeze is not an independent buy signal. The rules of Bollinger Bands founder John Bollinger remind us that touching the upper band is not itself a sell signal; similarly, for a squeeze, avoid directly translating a change in volatility into a direction forecast. Price may first spike up and then fall back into the range, may first break down and then reverse, or may continue to oscillate in a narrow range.
Diagram: the same squeeze, two possible paths
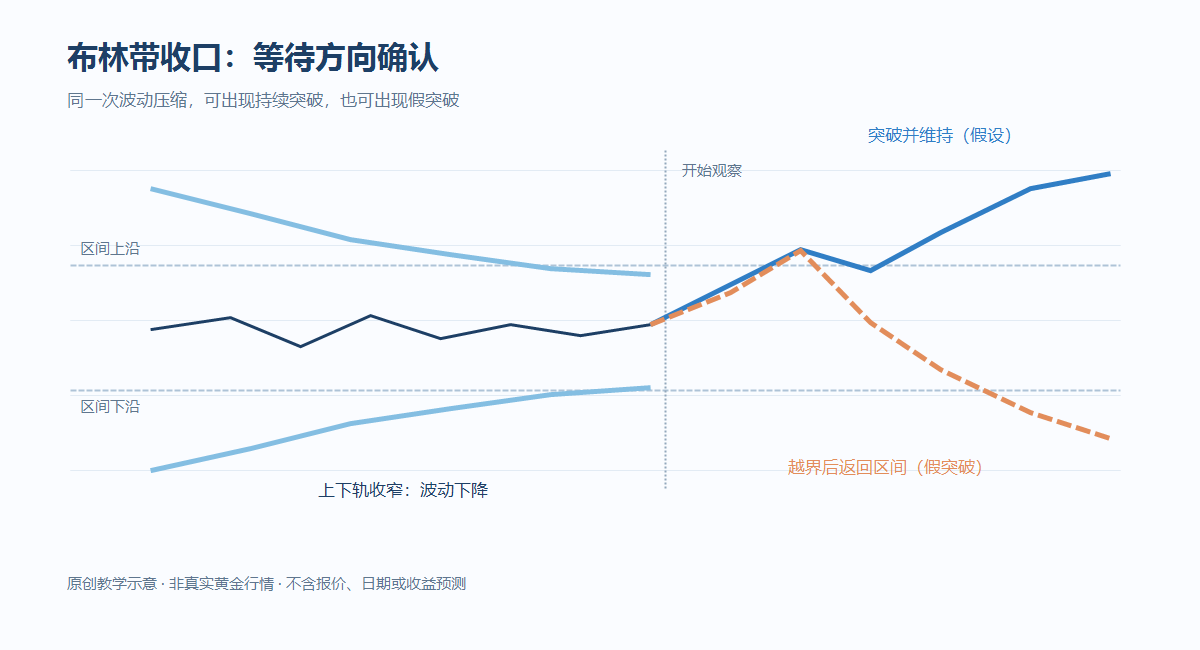
The light blue upper and lower bands on the left gradually move closer together, representing recent volatility compression; the vertical line in the middle indicates the start of observing a breakout, not an automatic entry point. The solid blue line on the right is one possibility: a completed candlestick crosses above the upper edge of the range, and a subsequent retest still holds the original range boundary; the orange dashed line is another possibility: price briefly crosses above the upper edge, then returns into the range and moves downward. The two lines cannot both be treated as forecasts; they are only used to remind you that opposite scenarios must be prepared for during a squeeze.
Build an observation record in four steps
First, fix the instrument, platform, chart timeframe and Bollinger Band parameters you are looking at, and note the time when the squeeze begins. Different brokers' XAUUSD quotes and server time zones may differ; do not splice candlesticks from two sources. Second, first draw the upper and lower boundaries of the range that price has actually repeatedly touched, rather than judging resistance and support solely from the two Bollinger Band curves. Third, wait for the candlestick of your chosen timeframe to complete, observe whether it crosses the range and the corresponding band, and record whether it can hold after crossing. Fourth, write down invalidation conditions in advance: if the so-called upward break quickly falls back into the original range, the upward breakout hypothesis needs to be withdrawn; if a downward break quickly recovers into the range, the same applies to the downward hypothesis.
If only the bands expand outward but price has not yet crossed a clear range boundary, you can record 'volatility expanding, direction unconfirmed.' If a long wick appears first, do not treat the intraday momentary price as the closing result of a completed candlestick. This is especially true for short timeframes: widened spreads and slippage during news releases can be enough to make the breakout on the chart differ from the actual executable result.
In which cases are misjudgments likely
Narrow sideways movement can last a long time, so you cannot assert that the next candlestick must break out just because 'the squeeze has lasted three days.' Setting too short a moving-average window makes the bands more sensitive to small fluctuations; continuously adjusting parameters until a certain historical chart looks good creates after-the-fact explanations. In a strong trend, price may also run along the upper or lower band, and touching a band does not mean it will immediately return to the middle band. XAUUSD spot contracts for difference usually lack a unified centralized volume measure, so the volume bars of a particular platform should not be unconditionally treated as volume confirmation for the entire gold market.
A more reliable review method is to record all squeeze samples under the same set of rules: bandwidth measure, range boundaries, first crossing, whether price returns, costs and the final invalidation point. Keeping examples of false breakouts and no breakouts together is the only way to check in which environments the method does not work. Bollinger Bands are a tool for organizing observations, not a direction oracle; any trade must still check the platform's contract specifications, risk budget and execution costs that may exceed expectations.

MT4 EA troubleshooting guides →